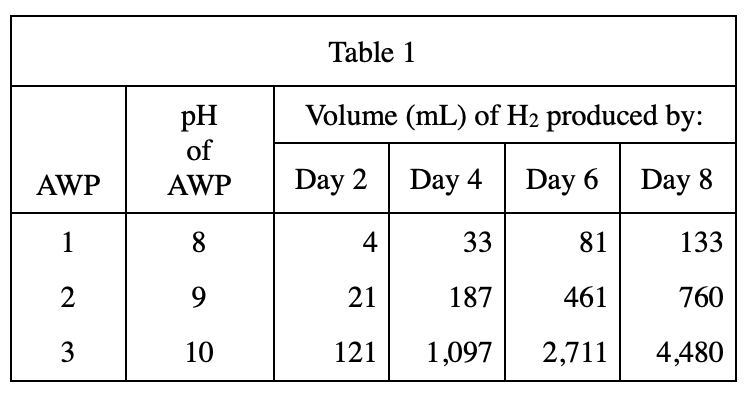
6. Based on Table 1, which of the following graphs best shows how the volume of H2 produced by AWP 2 changed over time?
Answer and Explanation
Your Answer is
Correct Answer is G
Explanation
According to Table 1, AWP 2 paint has been showing a growth trend within eight days, and the growth rate is getting faster and faster, so choose G