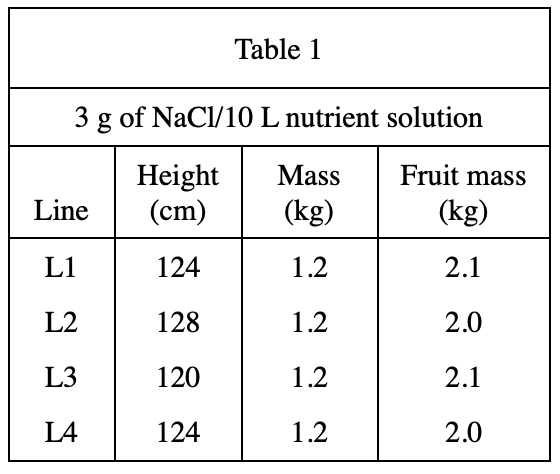
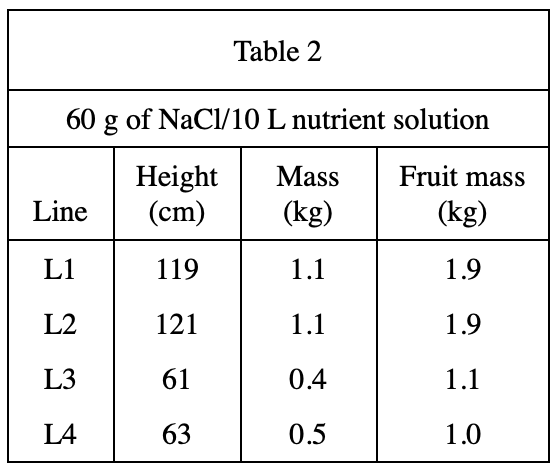
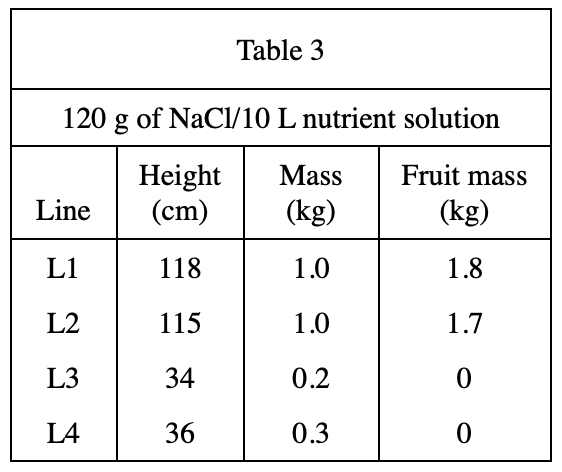
34. Suppose the data for all of the plants were plotted on a graph with height on the x-axis and mass (without fruit) on the y-axis. Suppose also that the best-fit line for these data was determined. Which of the following would most likely characterize the slope of this line?
Answer and Explanation
Your Answer is
Correct Answer is J
Explanation
This question needs to be clear that the horizontal and vertical coordinates represent the height and weight of the plant respectively. From tables 1-3, it can be seen that the higher the height, the heavier the weight, no matter for ordinary plants or for high-salt-tolerant plants. High, the different sensitivity of different plants to salt will only cause the slope to be different, and will not make it negative