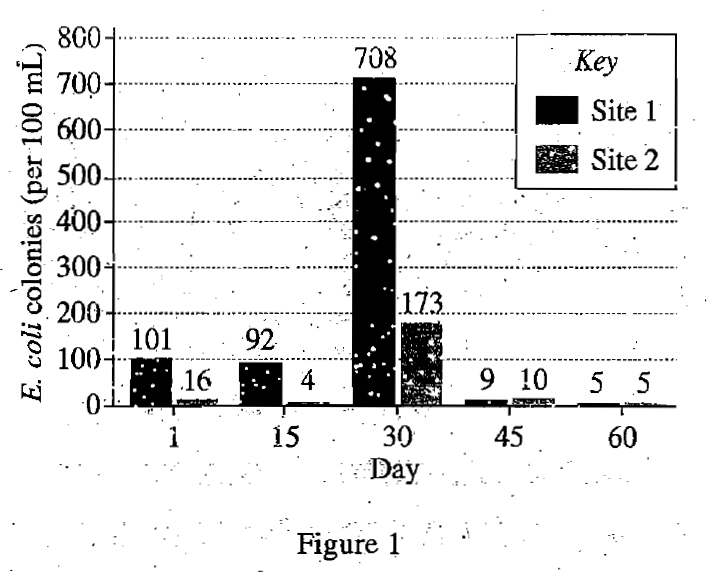
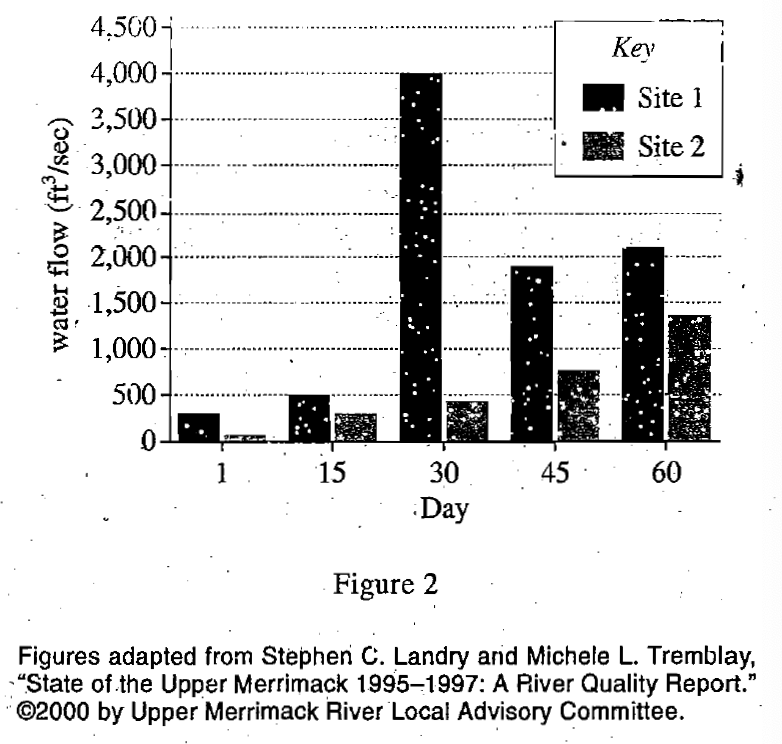
2. Based on Figures 1 and 2, consider the average water flow and the average E. coli level for Site 1 and Site 2 over the collection period. Which site had the higher average water flow, and which site had the higher average E. coli level?
Higher water flow ---- Higher E. coli level
Answer and Explanation
Your Answer is
Correct Answer is F
Explanation
From figure 1, it can be seen that the content of E. coli in Site 1 is obviously higher; from figure 2, it can be seen that the water velocity of Site 1 is higher