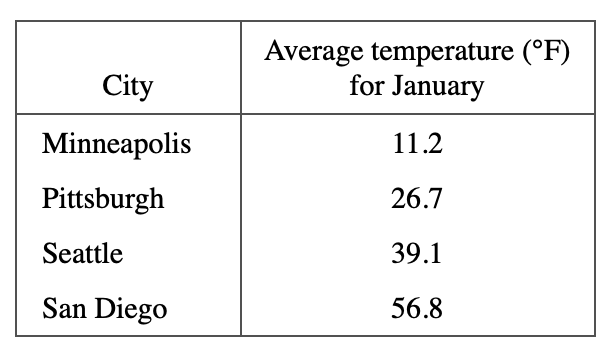
8. Based on the results of the experiments and the information in the table below, cars in which of the following cities would most likely contribute the greatest amount of CO to the atmosphere in January ? (Assume that the types, numbers, and ages of cars used in each city are approximately equal.)
Your Answer is
Correct Answer is F
Explanation
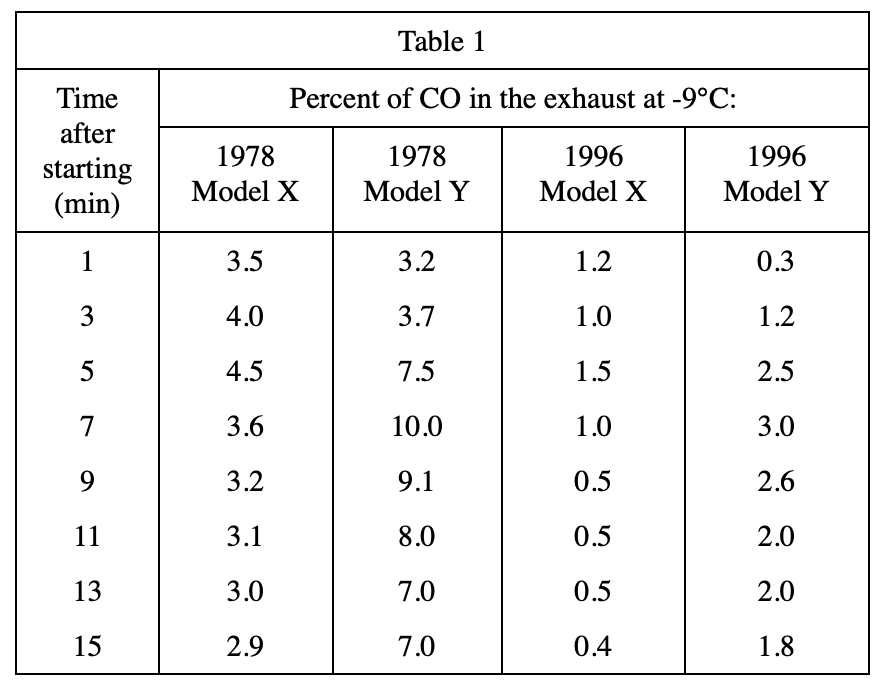
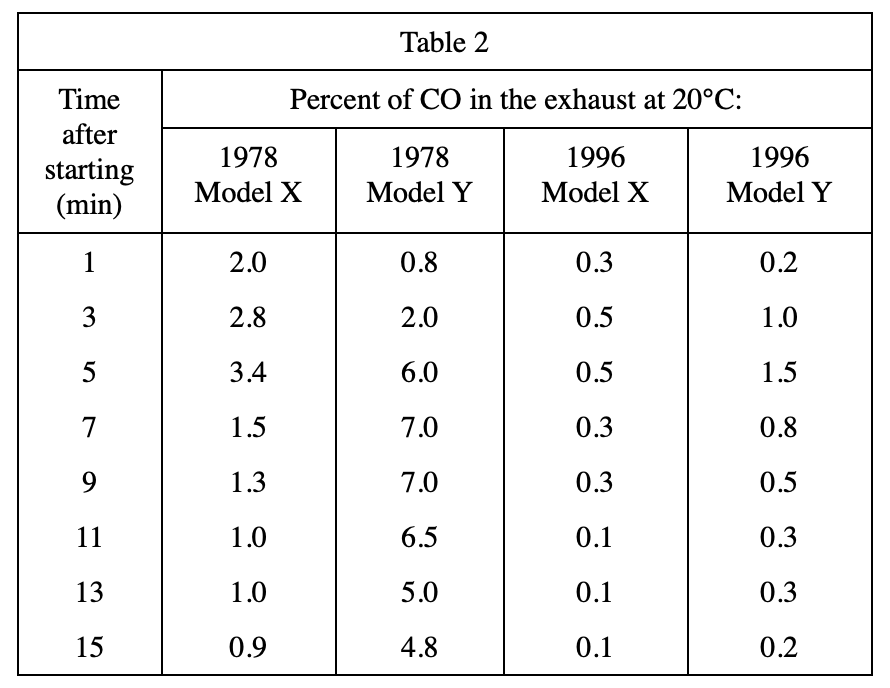
Comparing Experiment 1 and Experiment 2, we can see that the difference between the two experiments is that the experimental condition of Experiment 1 is -9°C, while that of Experiment 2 is 20°C.
By comparing table 1 and table 2, it can also be seen that CO emissions are greater at -9°C than at 20°C. That is, the lower the temperature, the greater the CO emission.
So among the four cities given in the table in the question, the coldest Minneapolis has the largest emissions