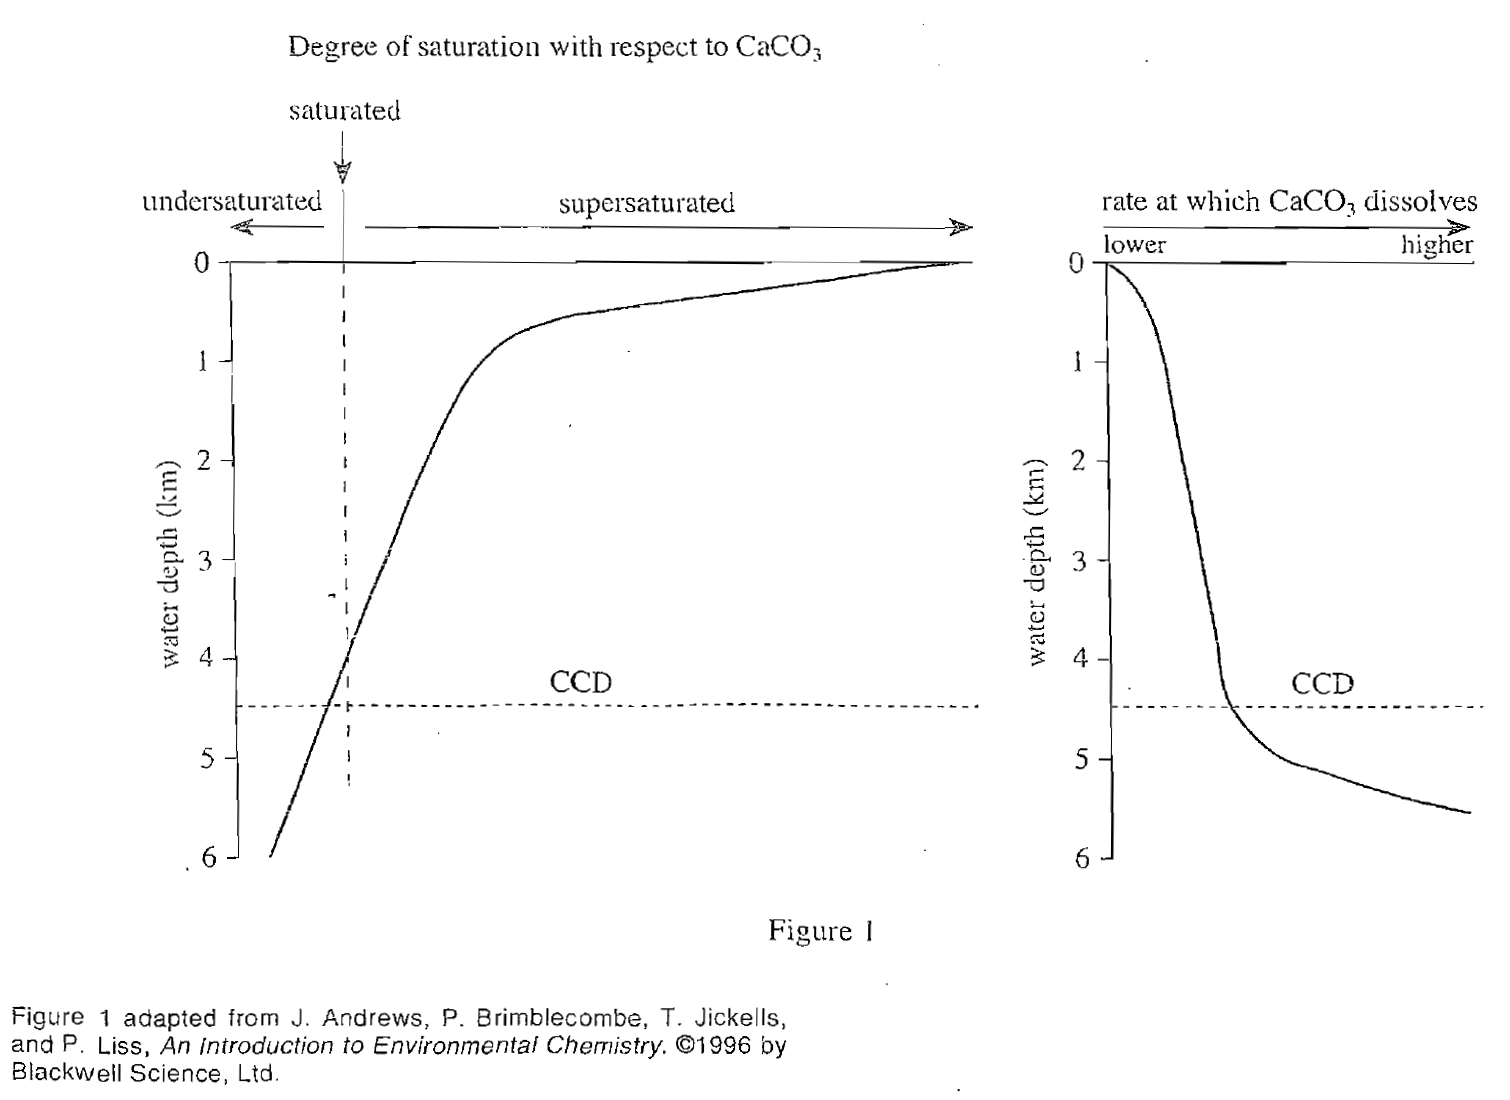
40. Figure 1 shows that the rate at which CaCO3 dissolves increases the most between which of the following depths ?
Answer and Explanation
Your Answer is
Correct Answer is J
Explanation
Looking at the right half of figure 1, it can be seen that when the depth is 5 km-5.5 km, the slope of the curve is relatively increased, indicating that the rate at which CaCO3 dissolves has increased p>