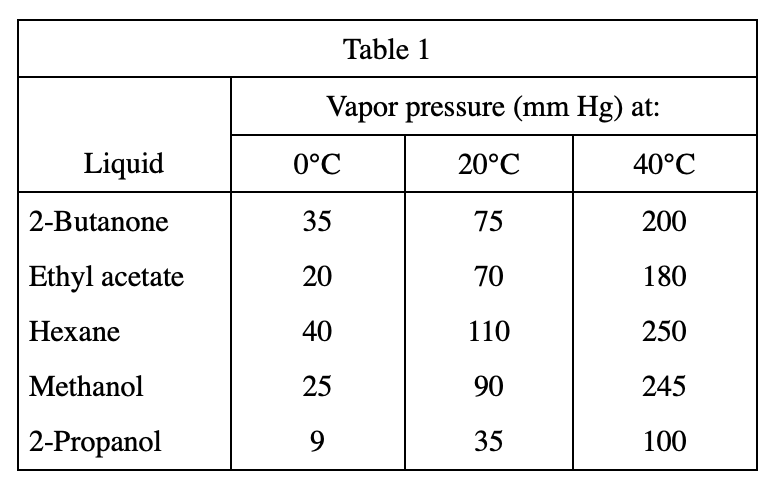
23. Which of the following bar graphs best represents the vapor pressures of the liquids from Experiment 1 at 20°C ?
Answer and Explanation
Your Answer is
Correct Answer is C
Explanation
Looking at the column of table 1 where the temperature is 20°C, the vapor pressure of hexane should be the highest, followed by methanol, so you should choose C