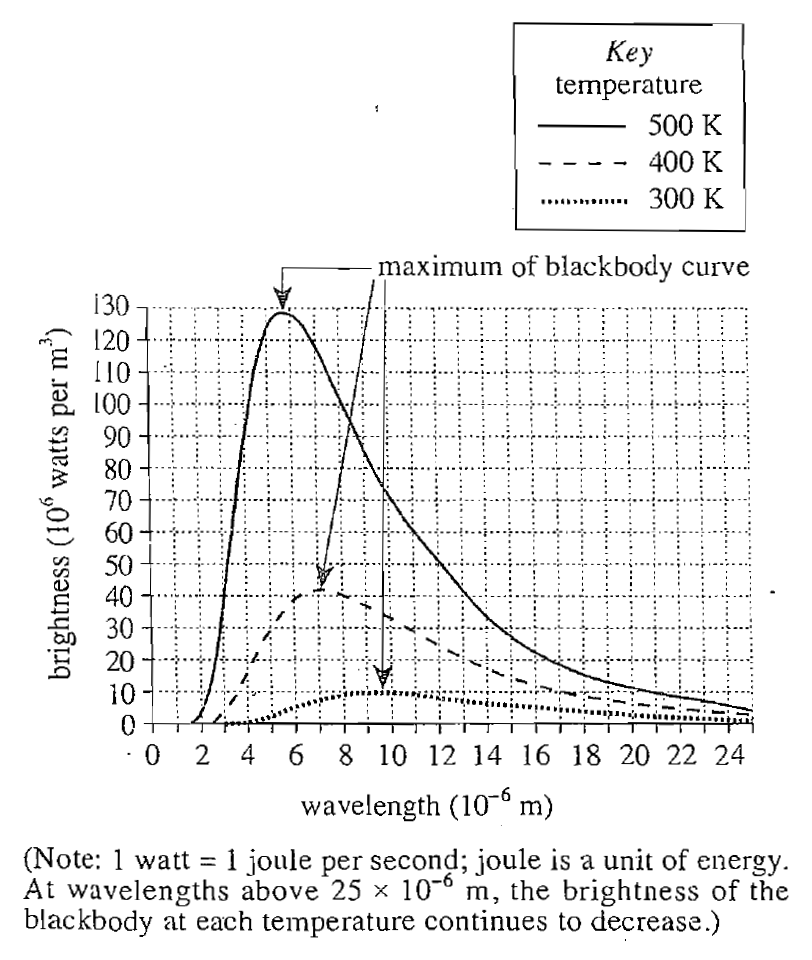
18. The area under each blackbocly curve gives the total amount of energy emitted every second by 1 m2 of the blackbody. Which of the following correctly ranks the 3 curves, from greatest to least, according to the total amount of energy emitted every second by 1 m2 of the blackbody at the wavelengths shown ?
Answer and Explanation
Your Answer is
Correct Answer is J
Explanation
It can be seen from the question stem that the area covered by the curve is the energy released by the blackbody of 1 m2 per second. It can be seen from the figure that the 500 K curve covers the largest area, and the 300 K curve covers the smallest area