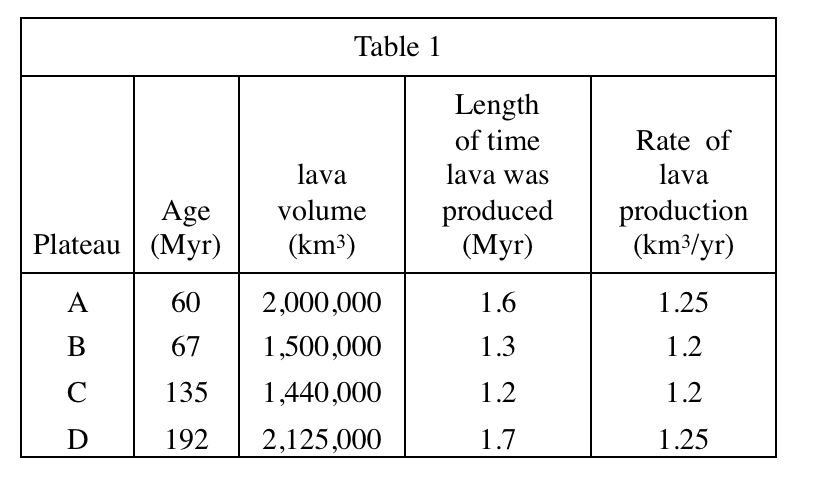
5. Which of the following graphs best represents the relationship between the age of a flood basalt plateau and the rate of lava production?
Your Answer is
Correct Answer is B
Explanation
It can be seen from table 1 that when the age of flood basalt plateau is 69 Myr and 192 Myr, the rate of lava production is too high, both are 1.25; when the age is 67 Myr and 136 Myr, the rate is too small, both are is 1.2. Therefore, the image should be high on both sides and low in the middle, so choose B

