Answer and Explanation
Your Answer is
Correct Answer is B
Explanation

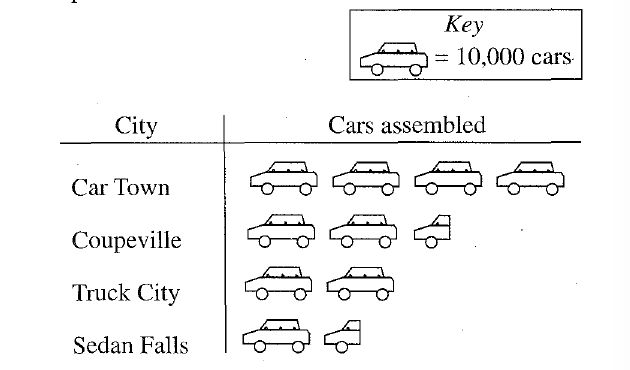
29. The graph below shows the number of cars assembled last year in 4 cities, to the nearest 5,000 cars. According to the graph, what fraction of the cars assembled in all 4 cities were assembled in Coupeville?
Your Answer is
Correct Answer is B
Explanation