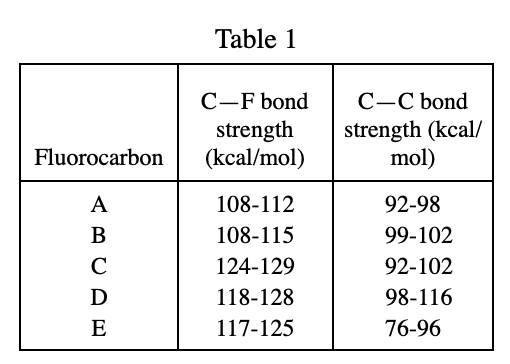
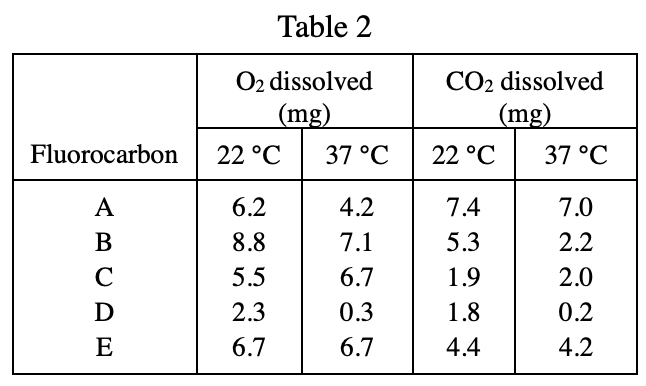
36. Which of the following graphs best illustrates the results of Experiment 3?
Your Answer is
Correct Answer is G
Explanation
According to the description in the last two lines of Experiment 3, flourine rises first and then falls, which is in line with option G

