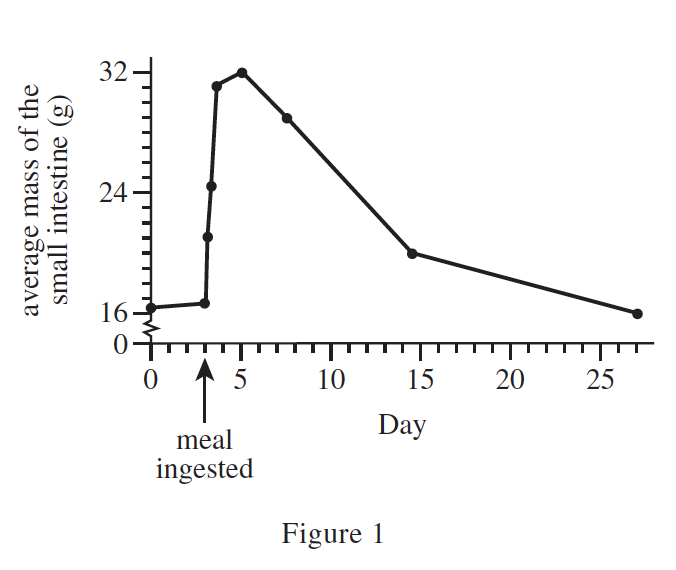
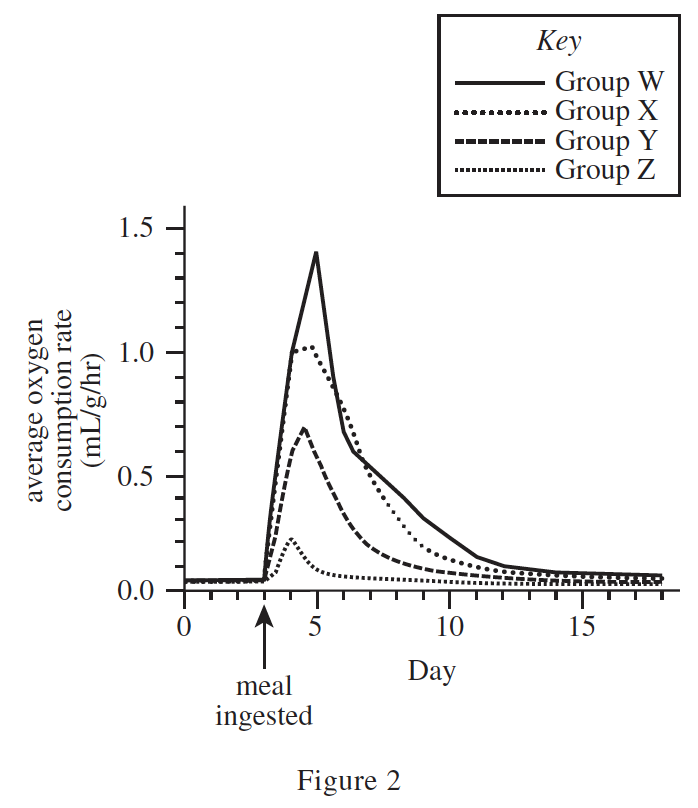
10. Based on Figures 1 and 2, when Group Y had an average oxygen consumption rate of 0.05 mL/g/hr between Day 0 and Day 5, the average mass of the small intestine for Group Y was most likely closest to which of the following values?
(Note: Assume that the pythons in Group V and the pythons in Group Y had approximately the same mass on Day 0.)
Answer and Explanation
Your Answer is
Correct Answer is G
Explanation
In Figure 2, when the vertical axis of Group Y is 0.05, the horizontal axis is Day 0 to Day 3. According to Figure 1, it can be seen that the mass of the intestine is about 16, and G is the closest