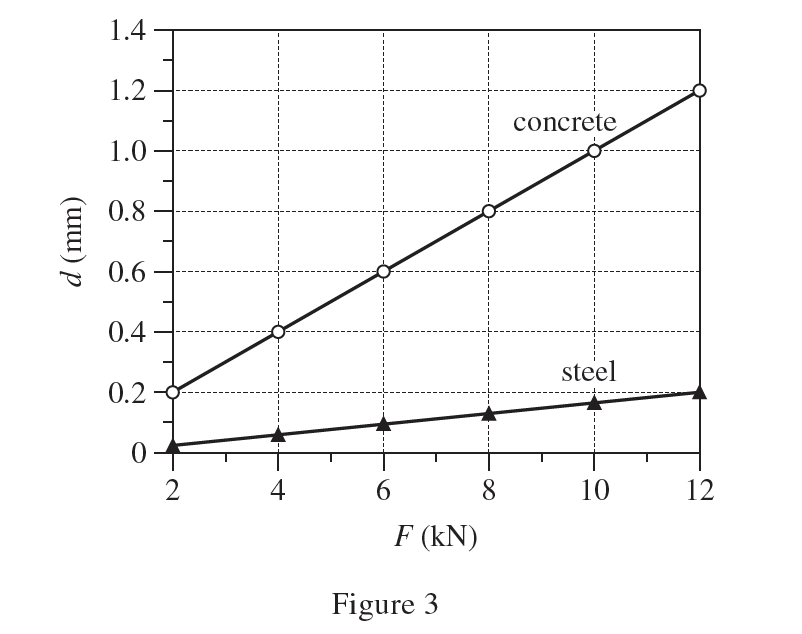
31. Suppose that in Study 3 the 2 beams had been tested in the H configuration. How would the results most likely have compared with the data shown in Figure 3 ? For each beam, the graph of d versus F would have been a straight line whose slope was:
Answer and Explanation
Your Answer is
Correct Answer is C
Explanation
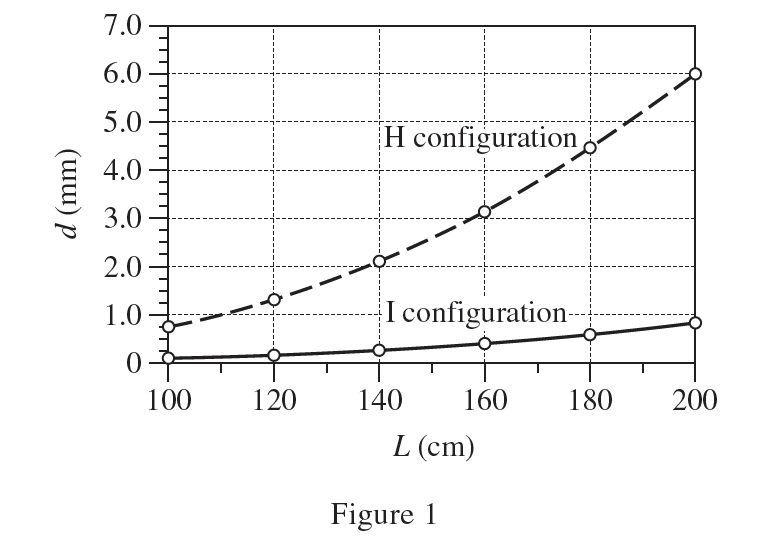
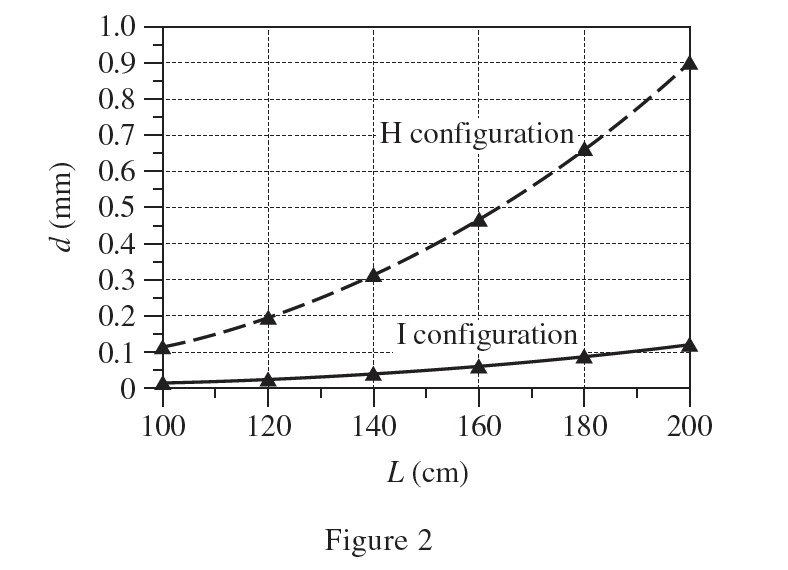
According to Figure 1&2, it can be seen that under the action of F, both beams will increase with the increase of L, so it is positively correlated; the deformation of H is more obvious than that of I, so H corresponds to the steeper curve; choose C