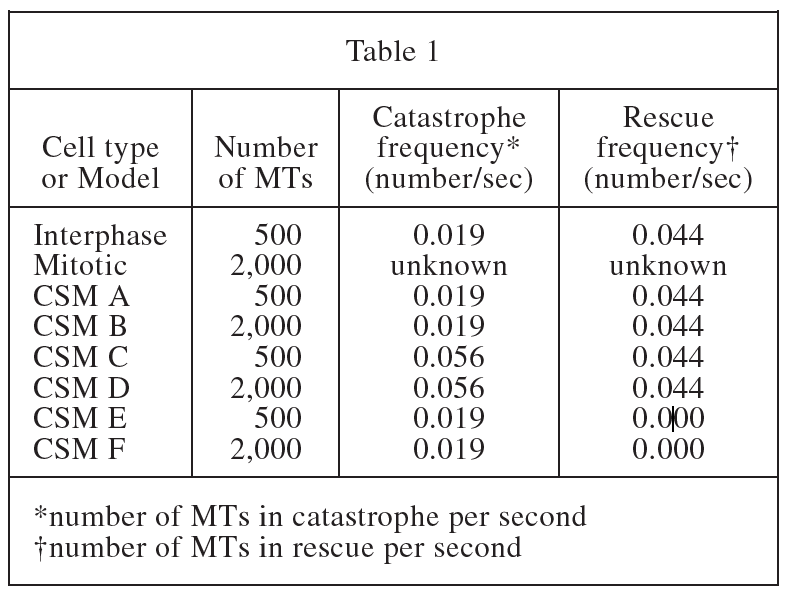
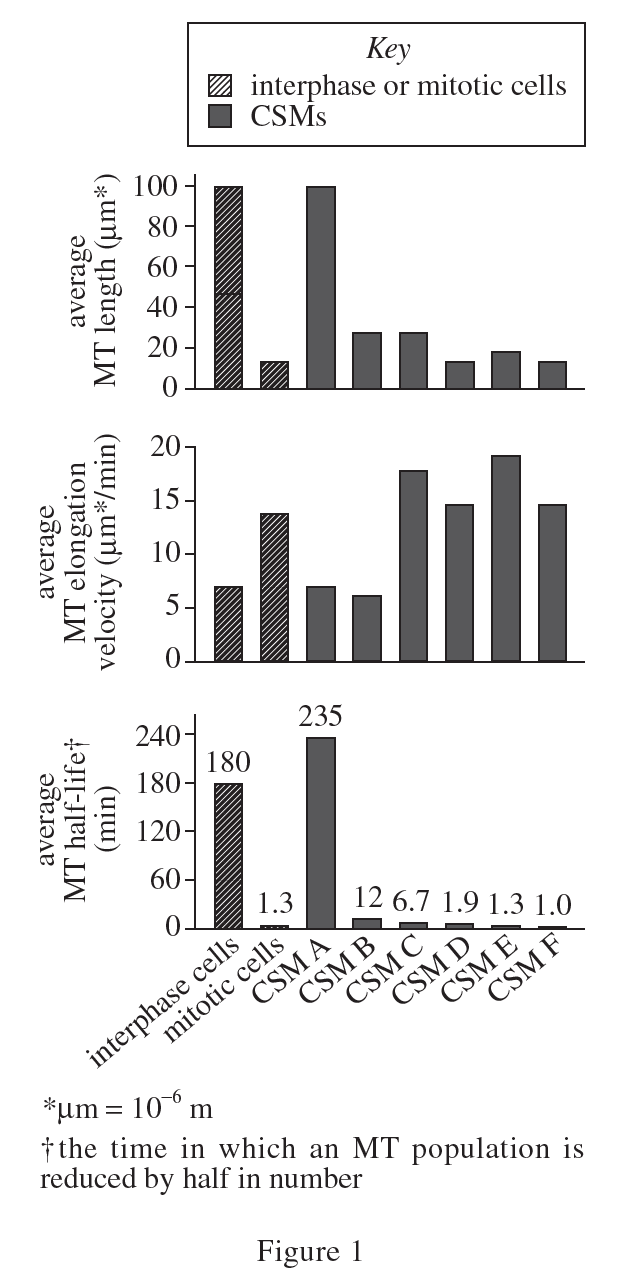
39. According to Figure 1, for which of the 3 MT characteristics did CSM B predict a value that was closer to that of interphase cells than to that of mitotic cells ?
Answer and Explanation
Your Answer is
Correct Answer is B
Explanation
The question stem is required to be found in the three pictures in figure 1. The values of CSM B and interphase cells need to be closer than the values of SCM B and mitotic cells, so only the second picture meets the requirements; the vertical axis of the second picture represents average MT elongation velocity, so choose B