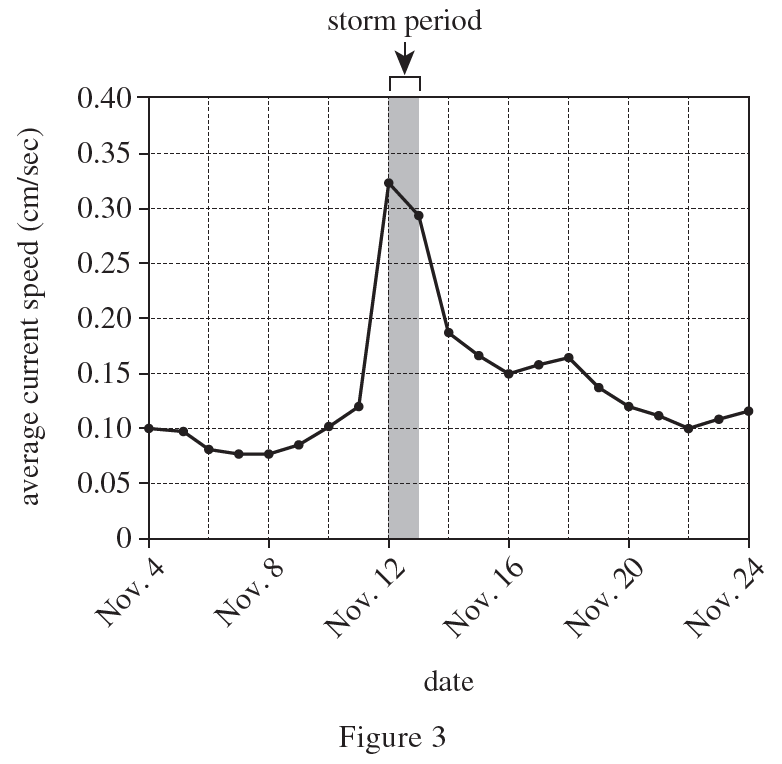
10. Each of the values of current speed plotted in Figure 3 is an average value. Based on the description of the study, is it more likely that each of these values was obtained by averaging measurements of current speed taken at different times of the day or by averaging measurements of current speed taken at different locations in the ocean ?
Answer and Explanation
Your Answer is
Correct Answer is F
Explanation
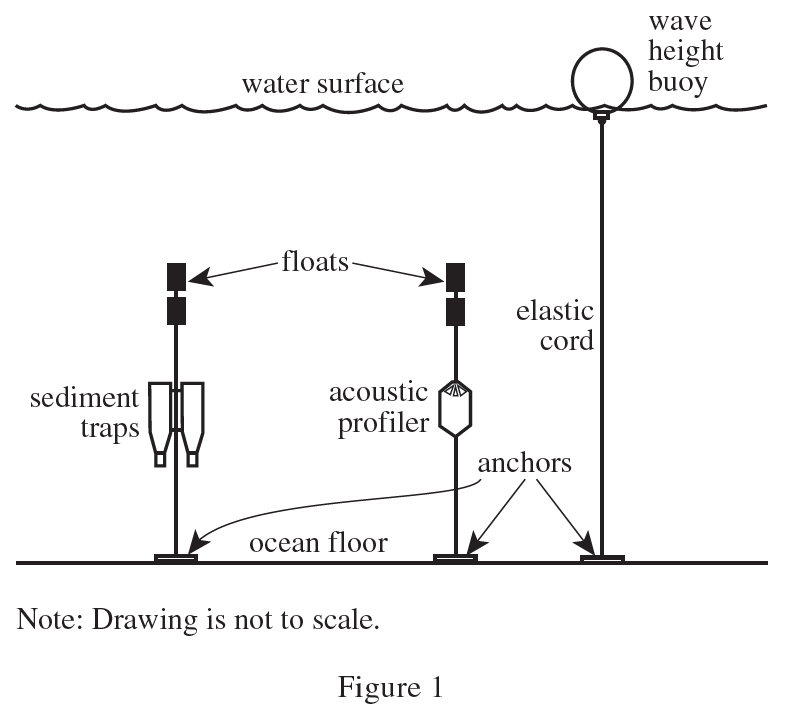
According to the information in the background section, it can be seen that the measurement facilities are fixed, so GHJ is excluded