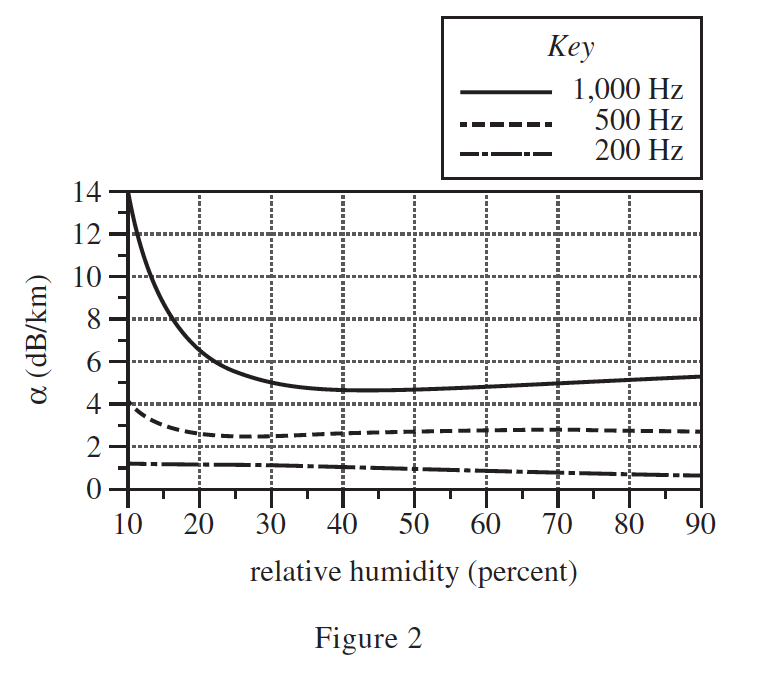
33. The graph below shows, for sound waves of 3 different frequencies, how α varies with relative humidity in air at a particular temperature.
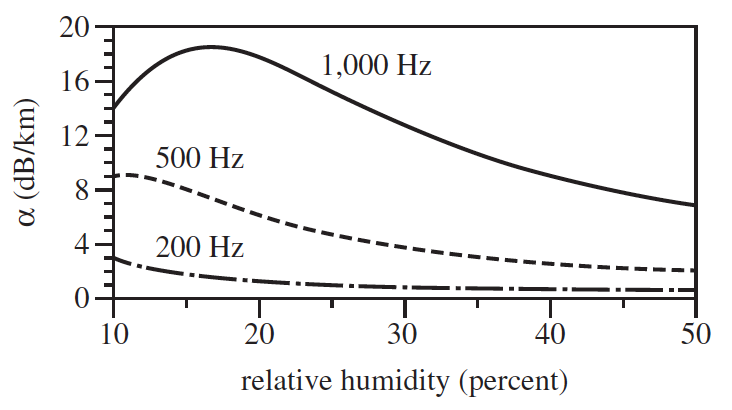
Based on Figure 1, the particular air temperature is most likely which of the following?
Answer and Explanation
Your Answer is
Correct Answer is B
Explanation
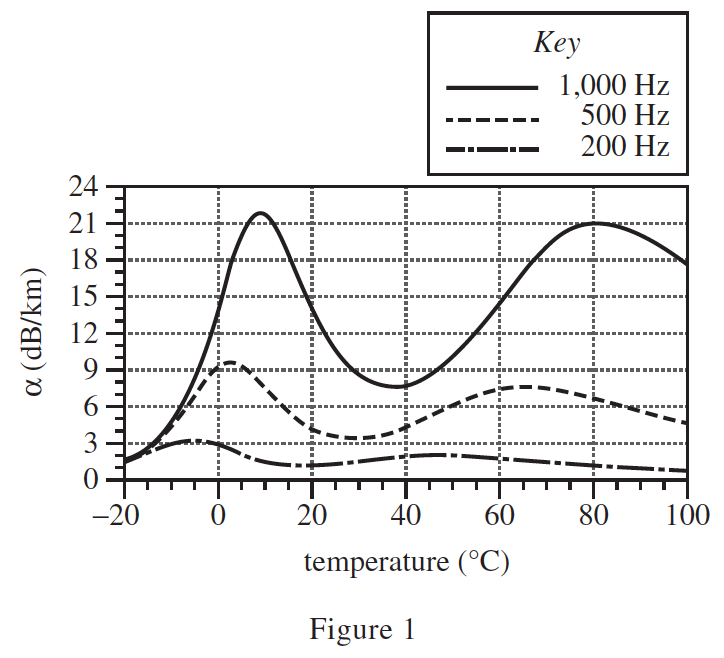
The question stem requires information based on Figure 1, because the corresponding humidity in Figure 1 is 10%, so look at the picture given in question 33, and find that when the abscissa is 10, the ordinates are 3, 9, and 14 respectively; Look at Figure 1 again to find the abscissa when these three ordinates correspond to each other at the same time, only when it is 0 degrees.