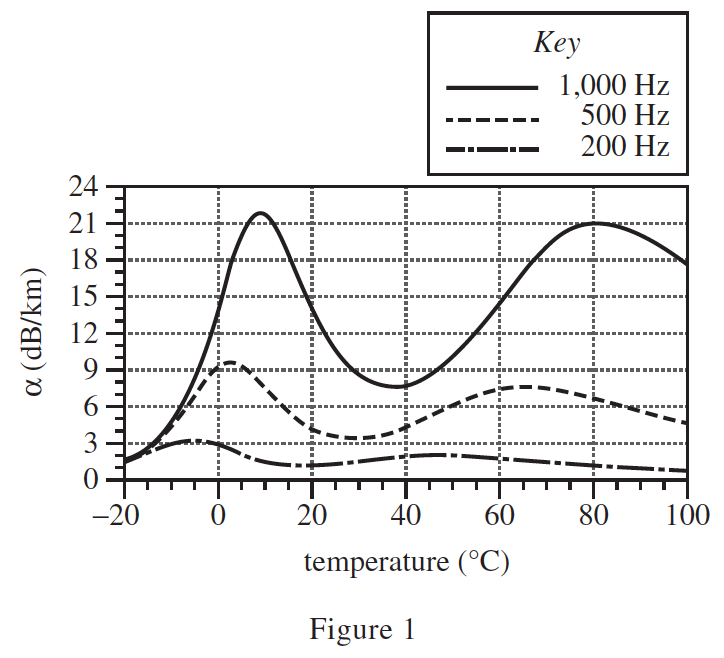
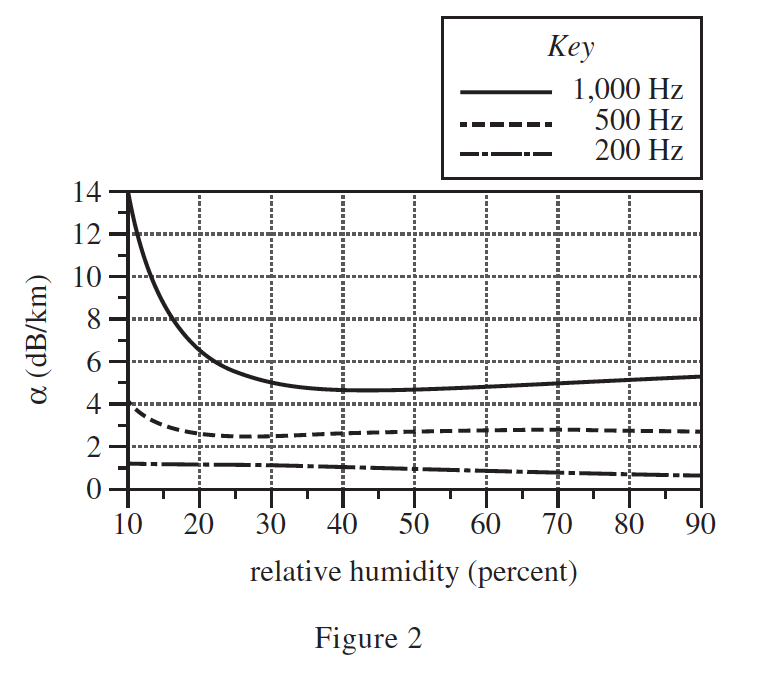
30. For the range of temperatures and the range of relative humidities shown in Figures 1 and 2, respectively, is α for a 200 Hz sound wave more strongly affected by changes in temperature or by changes in relative humidity?
Answer and Explanation
Your Answer is
Correct Answer is G
Explanation
Comparing the bottom line of the two Figures corresponding to 200Hz, it can be clearly seen that the fluctuation in Figure 1 is more obvious, and the maximum fluctuation can reach 2.5dB/km.