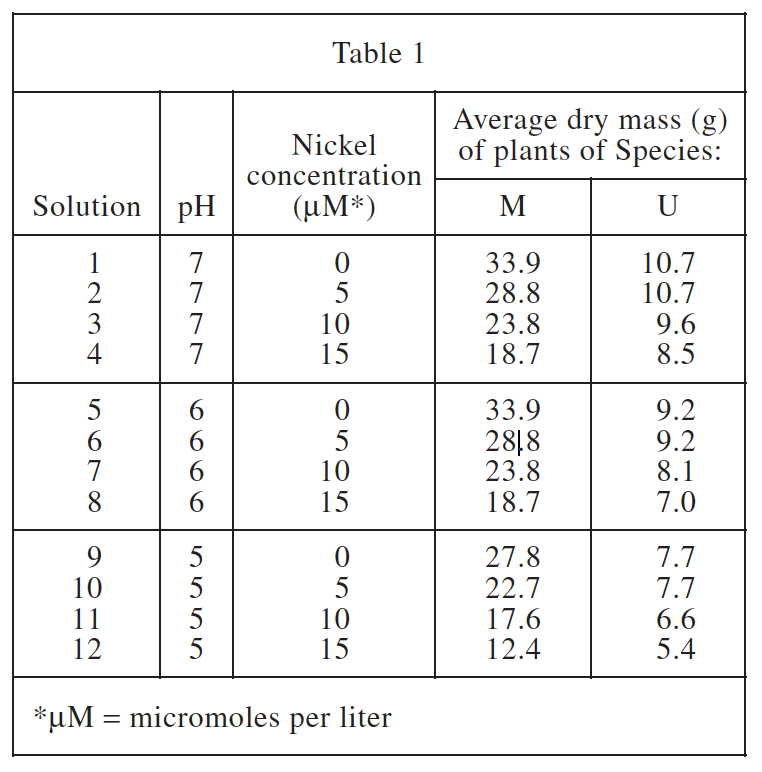
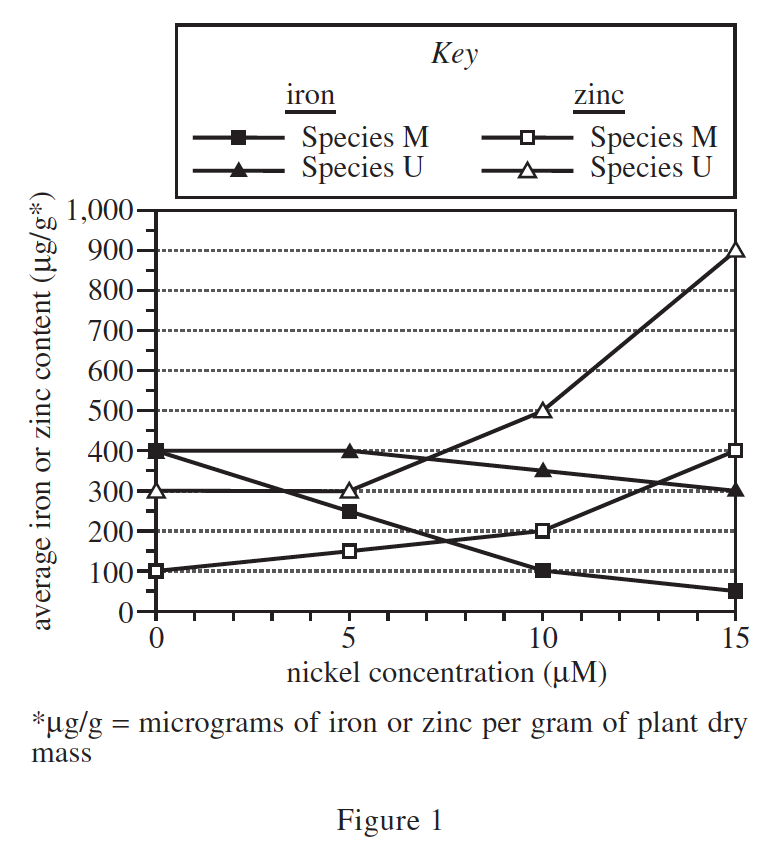
19. According to Table 1 and Figure 1, for the Species M plants that were fed Solutions 1−4, what was the order of the nutrient solutions, from the solution that resulted in the lowest average iron content to the solution that resulted in the highest average iron content?
Answer and Explanation
Your Answer is
Correct Answer is D
Explanation
Look at Table 1 first. When plant M is added to solutions 1-4, the Nickel concentration value corresponds exactly to the abscissa value in Figure 1. The solid triangle line representing the iron content of plant M is decreasing, so sort from small to large , should be 4321.