16. Based on the results of Experiment 3, which of the following graphs best shows the relationship between latitude and minimum speed required to avoid a collision?
Answer and Explanation
Your Answer is
Correct Answer is J
Explanation
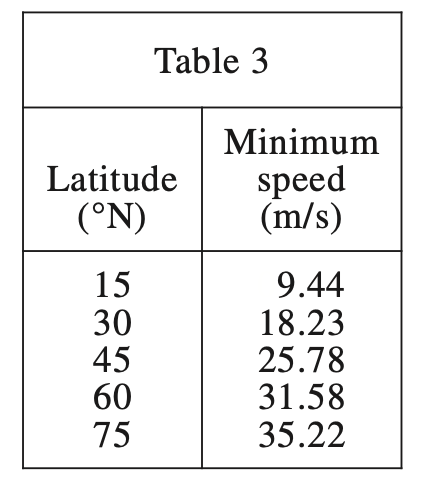
Looking at Table 3, as the latitude increases, the minimum speed increases. Every time the Latitude increases by 5°, the speed increases less and less, so you should choose a curve with a positive slope but a gradually decreasing slope. Option J is reasonable.