35. Assume that Figures 2 and 3 are drawn to scale. Which of the figures, if either, implies that the distance between Earth and Mars varies with time?
Your Answer is
Correct Answer is C
Explanation
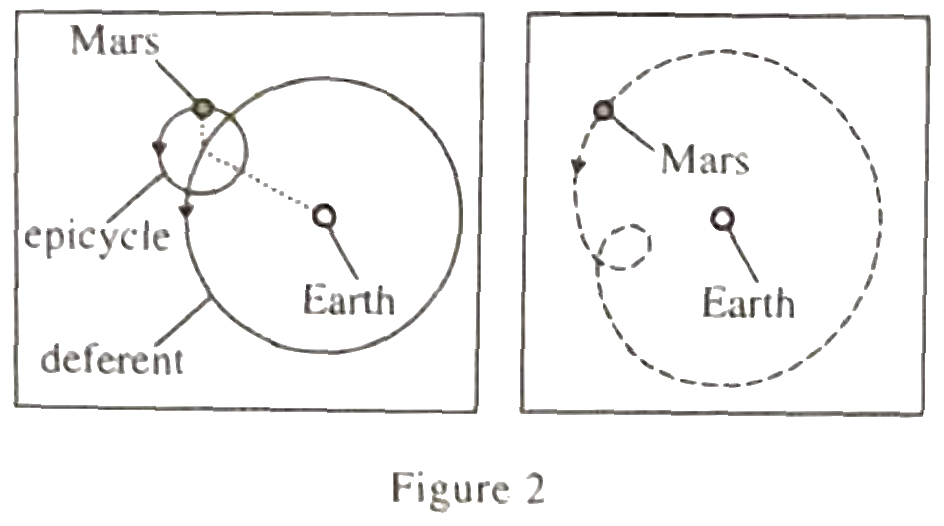
Let’s look at the picture on the right side of Figure 2 first. The dotted line trajectory is the orbit of Mars that the theory thinks about, so it can be seen that the distance between Mars and the Earth is changing in real time;
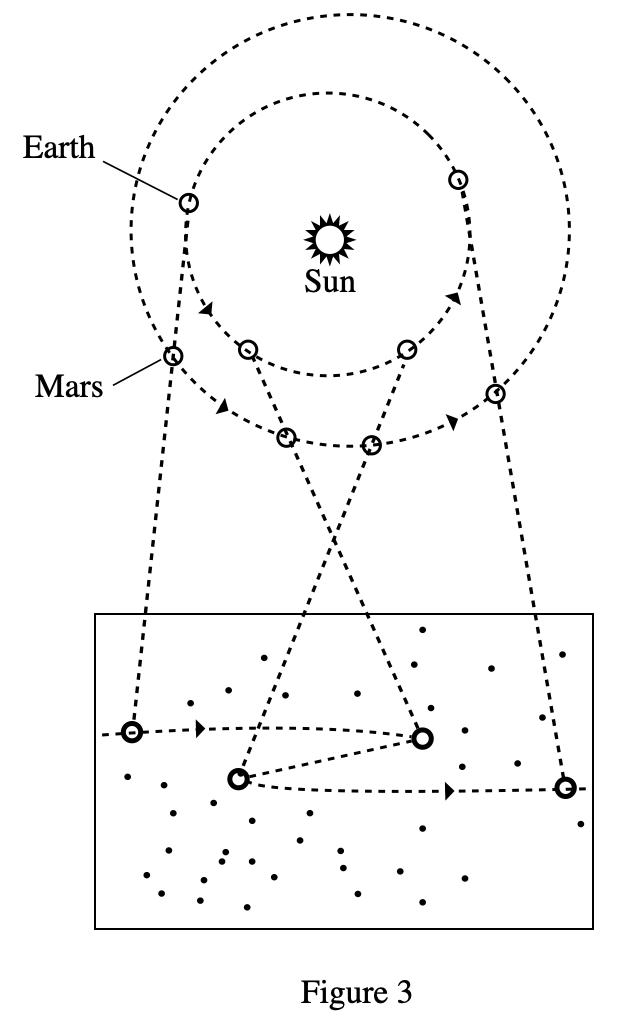
Then Look at Figure 3, the earth is inside Mars, so the angular velocity is greater than that of Mars. It can be understood that the relative position of the earth and Mars has always been in a cycle of "overtaking - catching up - overtaking - catching up", so the distance between the two is not stable.
So both pictures show that the distance between Mars and the Earth is not constant, so you should choose C.