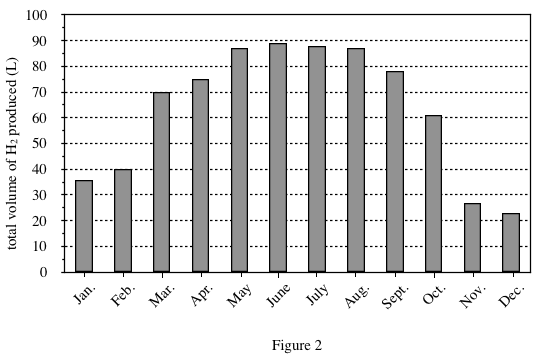
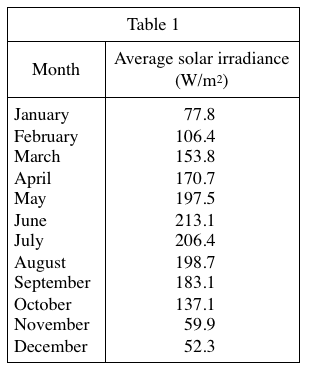
27. Based on Figure 2 and Table 1, during the month in which a total of 70 L of H2 was produced, the average solar irradiance was:
Answer and Explanation
Your Answer is
Correct Answer is B
Explanation
First look at figure2 and find that 70L H2 corresponds to March, then go to the table to find the value corresponding to March, and find that it meets option B