Answer and Explanation
Your Answer is
Correct Answer is A
Explanation
Based on the first chart, you can calculate the proportion of the number of people in each age group. The proportion of people aged 51 and over is 400/5000=8%, so choose A
Use the following information to answer questions 19-21.
A large theater complex surveyed 5,000 adults. The results of the survey are shown in the tables below.
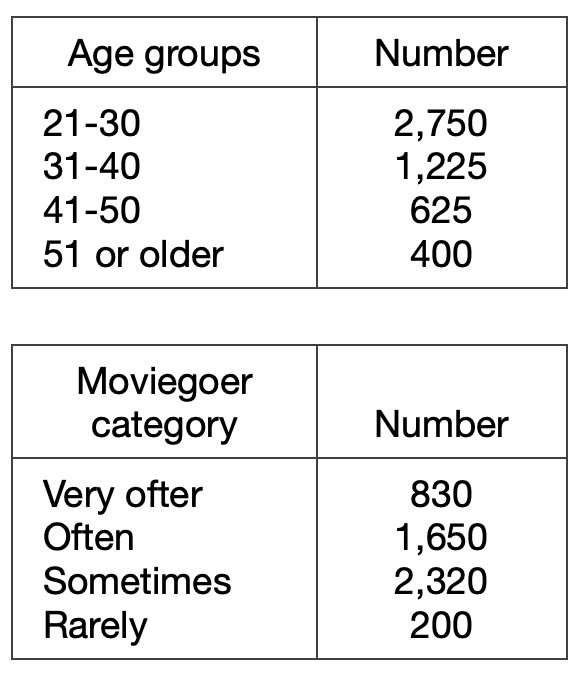
Tickets are $9.50 for all regular showings and $7.00 for matinees.
21. One of the following circle graphs represents the proportion by age group of the adults surveyed. Which one?
Your Answer is
Correct Answer is A
Explanation
Based on the first chart, you can calculate the proportion of the number of people in each age group. The proportion of people aged 51 and over is 400/5000=8%, so choose A