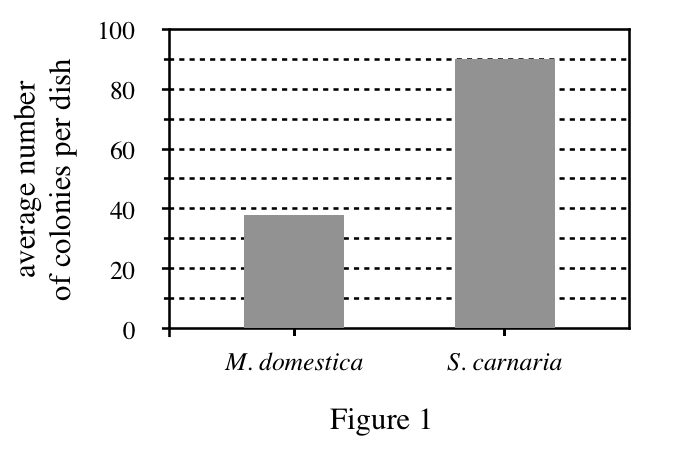
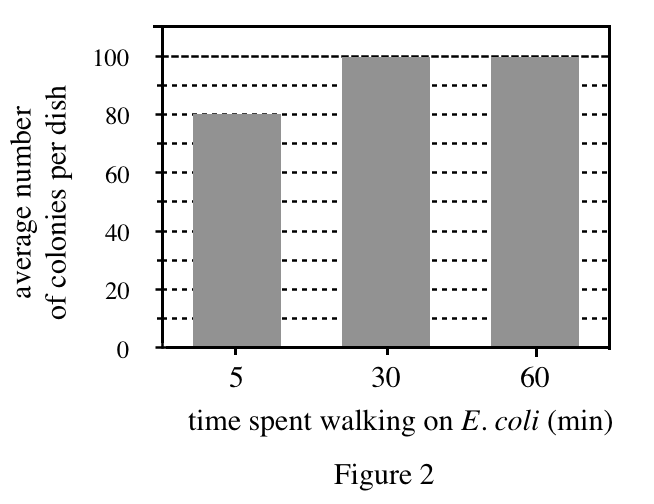
13. Which of the following is the most likely reason that the average number of colonies per dish for S. carnaria shown in Figure 1 was different from the average number of colonies per dish for the flies that spent 5 min walking on the E. coli in Experiment 2 ?
Answer and Explanation
Your Answer is
Correct Answer is B
Explanation
Reading the description of Experiment 1, I found that the flies also walked for 5 minutes in Experiment 1. That is to say, when the variable is well controlled, the difference in the dependent variable can only be the natural fluctuation of the sample. Less