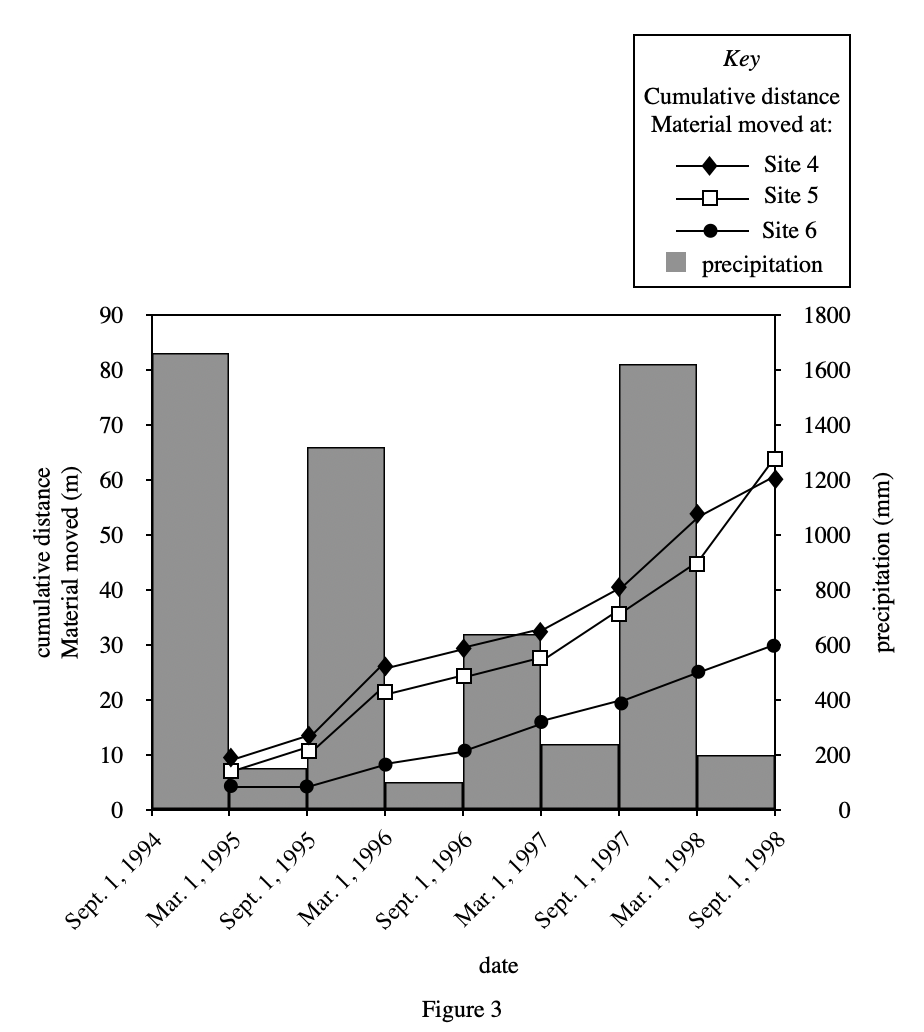
9. According to Figure 3, which of the following graphs best shows the cumulative distance that material moved at Sites 4-6 by March 1, 1996 ?
Answer and Explanation
Your Answer is
Correct Answer is B
Explanation
Looking at figure 3, the abscissa is March 1, 1996, and the ordinate corresponding to Sites 4-5 is about 25, 20, and 8 respectively, so option B is in line