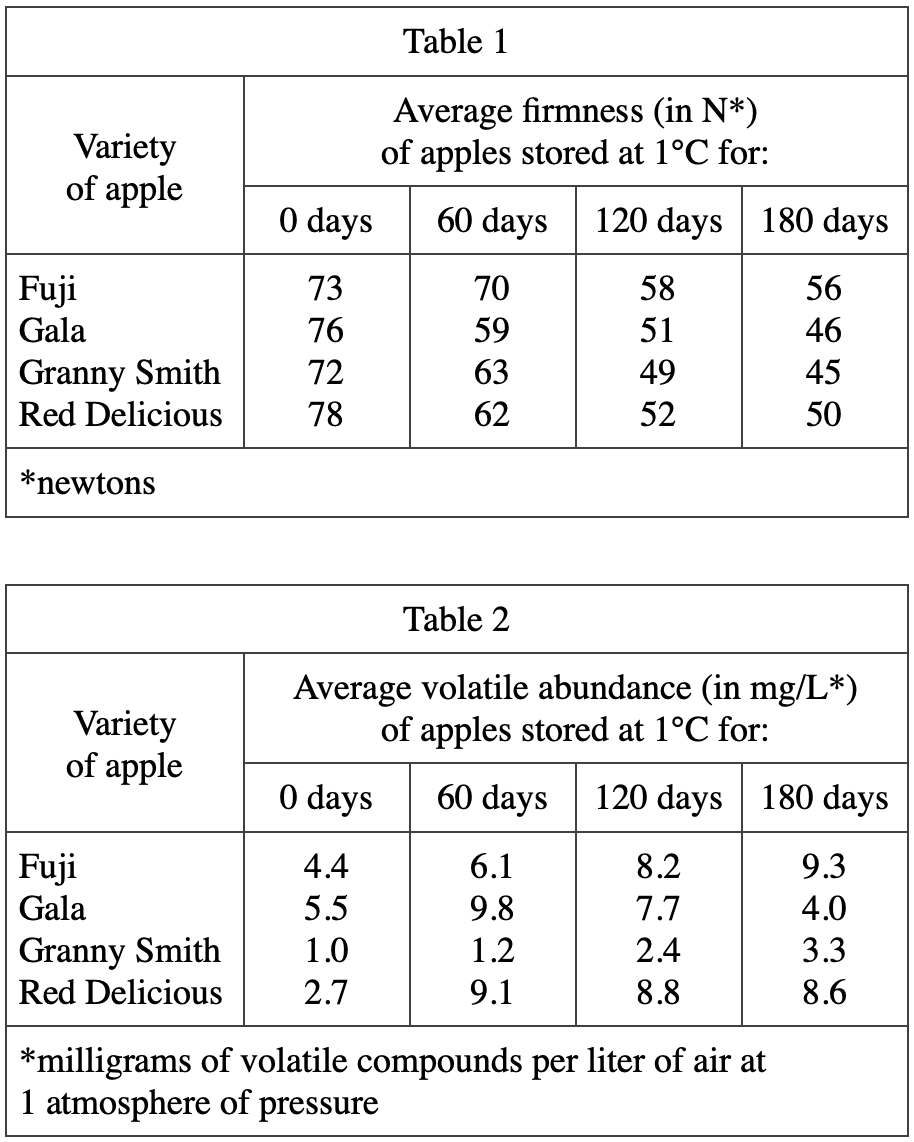
4. Based on Table 2, which of the following graphs best shows the average volatile abundances of the 4 varieties of apples at a storage time of 60 days?
Answer and Explanation
Your Answer is
Correct Answer is G
Explanation
Looking at the 60 days column in table 2, it is found that the average volatile abundance of the four kinds of apples is 6.1, 9.8, 1.2, and 9.1 respectively, so the G option is consistent