Answer and Explanation
Your Answer is
Correct Answer is C
Explanation
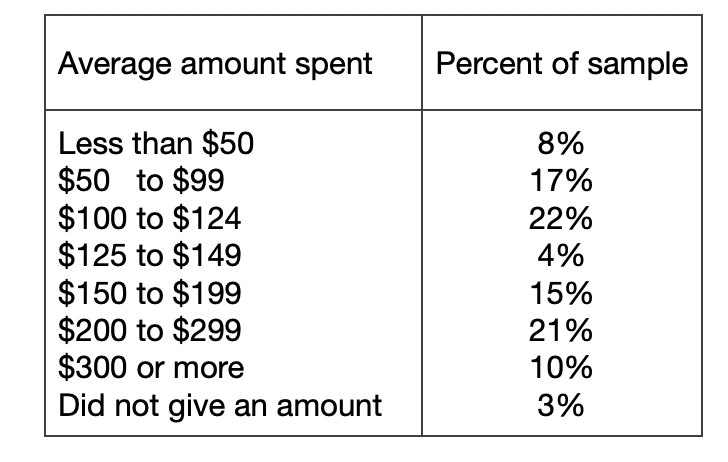
It can be seen from the table that the percentage of average spending of 300 US dollars or more per week is 10%, so in the circle chart, the central angle of the graph of average spending of 300 US dollars or more per week is 360°×10% =36°.