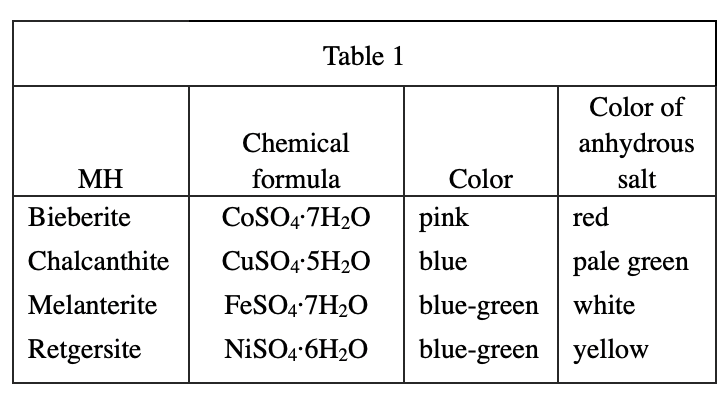
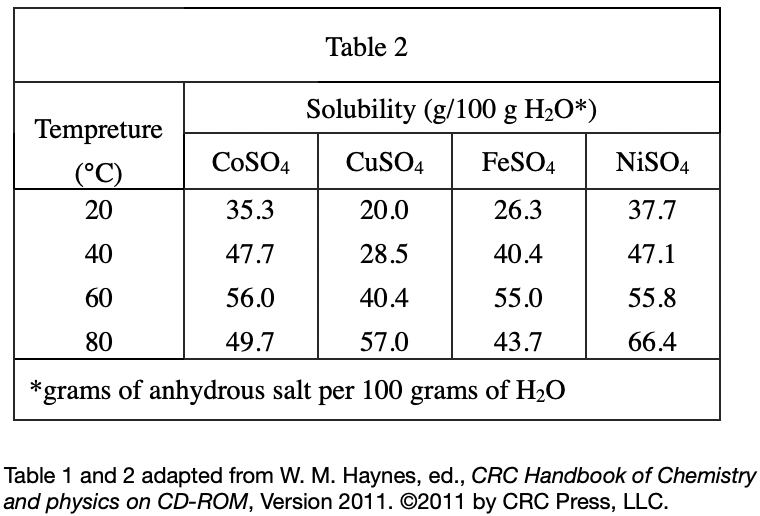
1. According to Table 2, which of the following graphs best shows, for each of the 4 anhydrous salts, the solubility in H2O at 80°C ?
Answer and Explanation
Your Answer is
Correct Answer is D
Explanation
Looking at the data in table 2 when the temperature is 80 degrees, it is found that all the data are in the range of 43.7-66.4, and the largest value corresponds to NiSO4, so option D is in line