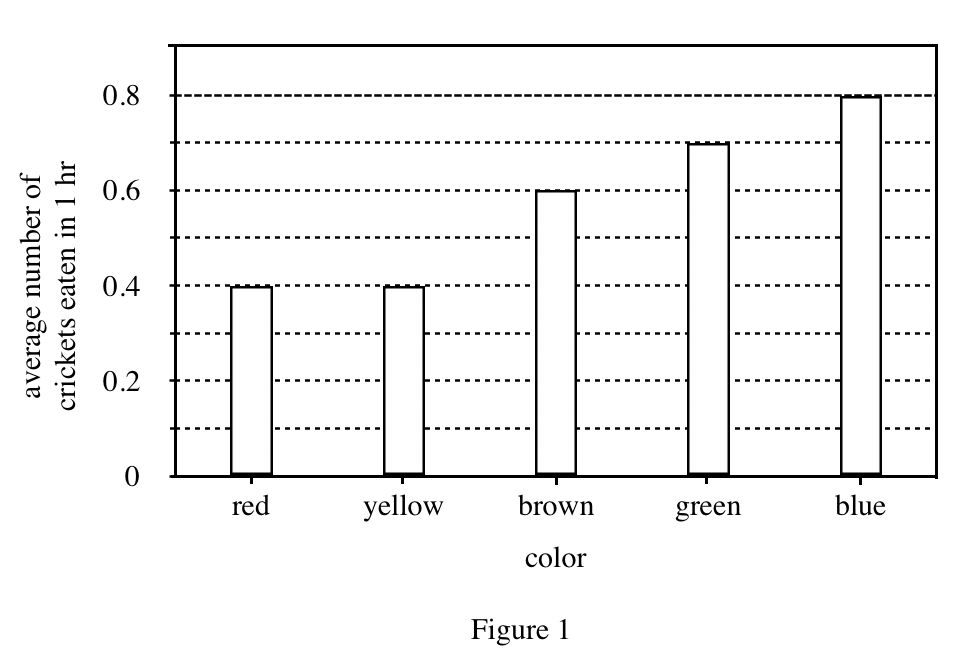
5. Each of the values plotted in Figure 1 was most likely calculated using which of the following expressions ?
Answer and Explanation
Your Answer is
Correct Answer is D
Explanation
First exclude options A and C because experiment 1 used wild spiders. Because the color of the prey is differentiated in the chart, the data should also correspond to different colors.