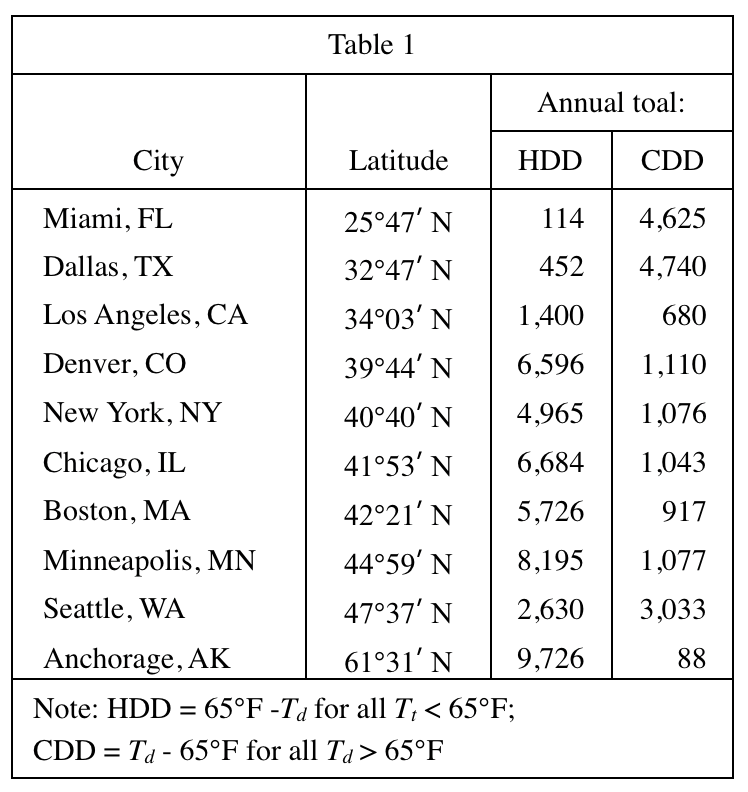
19. Which of the following graphs best illustrates the latitude and the CDD for each of the cities listed in Table 1 ?
Answer and Explanation
Your Answer is
Correct Answer is A
Explanation
The table in the question is arranged from south to north. Note that the question asks about CDD not HDD, and the starting point of the curve should be around 4000.