

16. Student 1 plotted the △t1 data versus x and then graphed a line of best fit to the data, as shown below.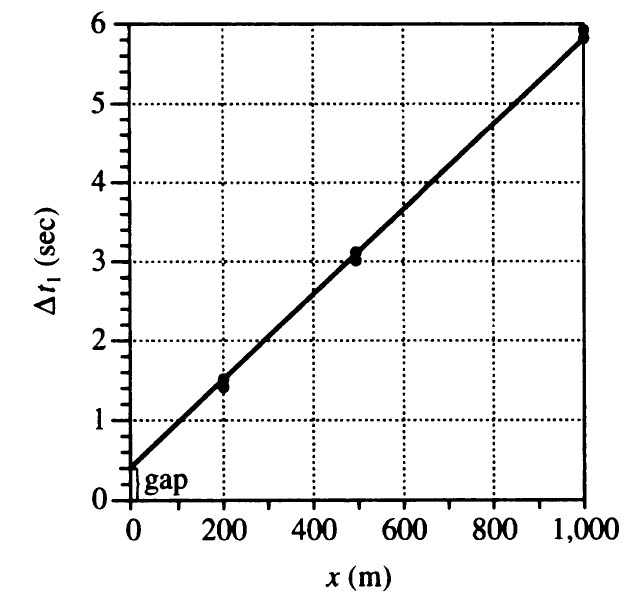
The gap shown near the bottom of the vertical axis suggests that even if the value of x had been 0 m, the value of △t1 would not have been 0 sec, as one might expect. Based on the description of Experiment 1, this gap was most likely the result of:
Answer and Explanation
Your Answer is
Correct Answer is F
Explanation
General knowledge questions.
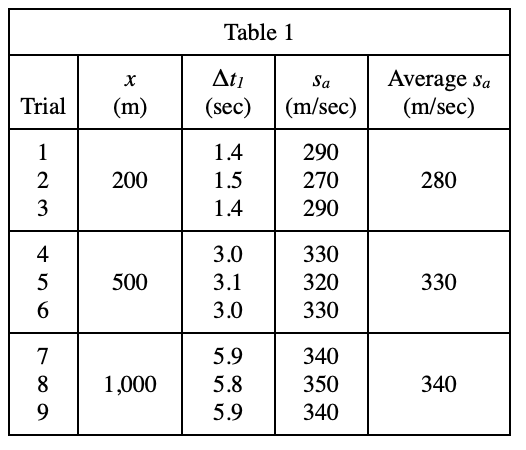
The obvious flaw in the design of Experiment 1 is that it relies on human hearing and reaction to time, which is prone to very large errors, because people need reaction time when timing, which will cause the recorded time to change. Long, the calculated speed of sound becomes smaller