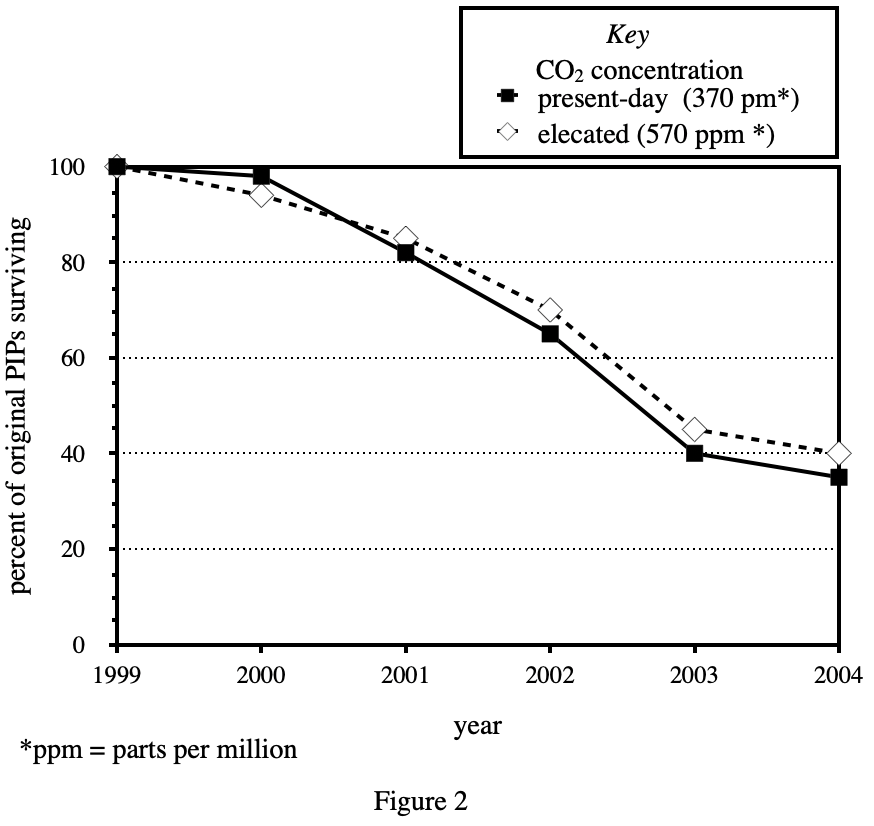
8. According to Figure 2, which plot had the higher percent of original PIPs surviving at the end of the study ?
Answer and Explanation
Your Answer is
Correct Answer is J
Explanation
The at the end of the study mentioned in the question stem corresponds to the abscissa in figure 2 being 2004. At this time, the elvated ordinate represented by the dotted line is higher, about 40%, while the present-day represented by the solid line The vertical axis of is lower, about 35%. The difference between the two is 40%-35%=5%, so option J is more suitable