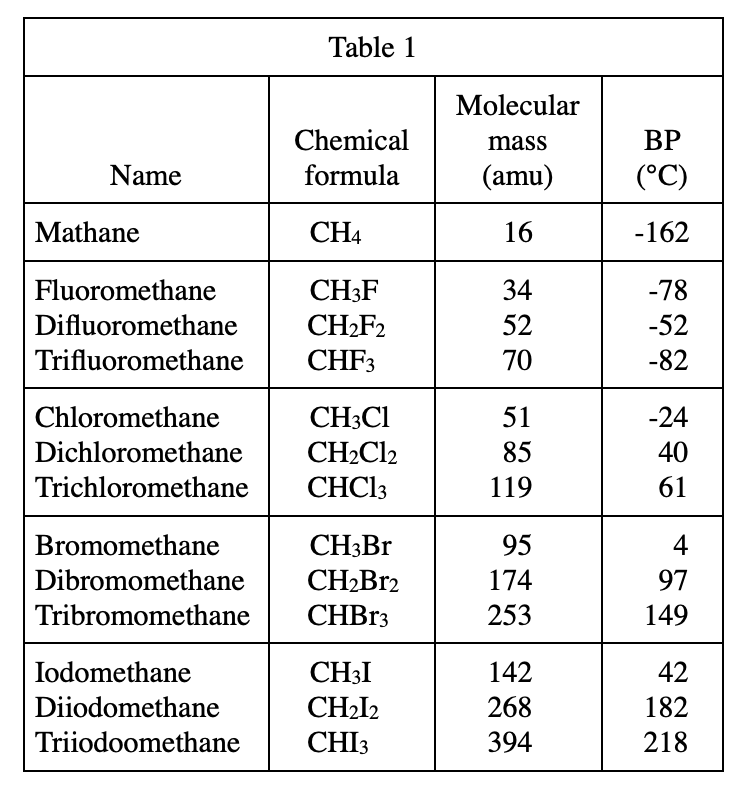
3. According to Table 1, the relationship between molecular mass and BP among the compounds CHCl3, CHBr3, and CHI3 is best represented by which of the following graphs ?
Answer and Explanation
Your Answer is
Correct Answer is A
Explanation
Looking at table 1, the molecular mass of CHCl3 is the smallest, with a BP of 61; the molecular mass of CHBr3 is in the middle, with a BP of 149; the molecular mass of CHI3 is the largest, with a BP of 218. Therefore, it can be judged that as the molecular mass increases, BP also increases. Then it should be a rising graph line, you can only choose A