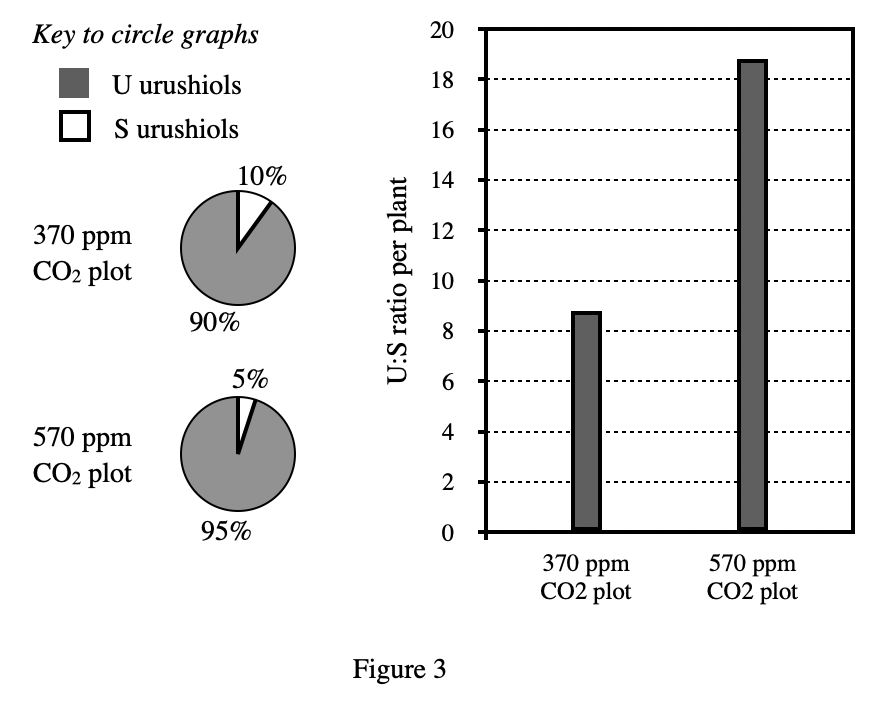
12. According to Figure 3, which plot produced a higher percent of S urushiols per plant ?
Answer and Explanation
Your Answer is
Correct Answer is F
Explanation
Looking at figure 3, the U:S ration corresponding to 370 ppm is lower, indicating that the proportion of S is relatively higher, and S accounts for about 10%