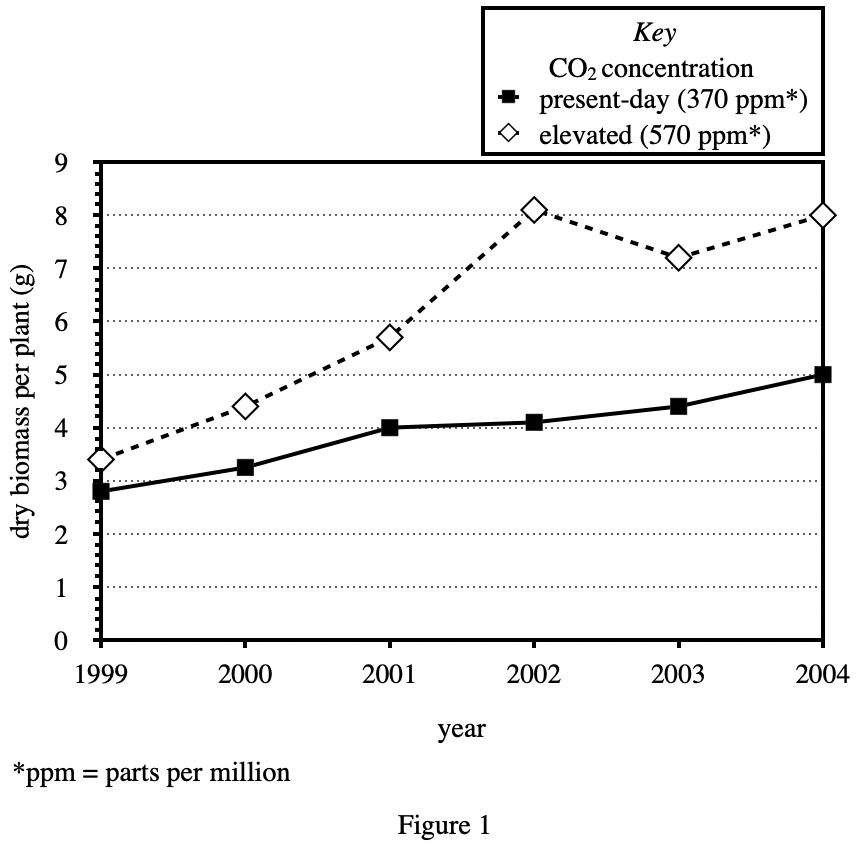
10. According to Figure 1, from 1999 to 2004, how did the dry biomasses per plant for the 2 plots compare? The dry biomasses per plant grown in a CO2 concentration of 370 ppm was:
Answer and Explanation
Your Answer is
Correct Answer is H
Explanation
According to figure 1, when the abscissa is the same, the ordinate of 370 ppm is always smaller than the ordinate of 570 ppm, so the H option is consistent