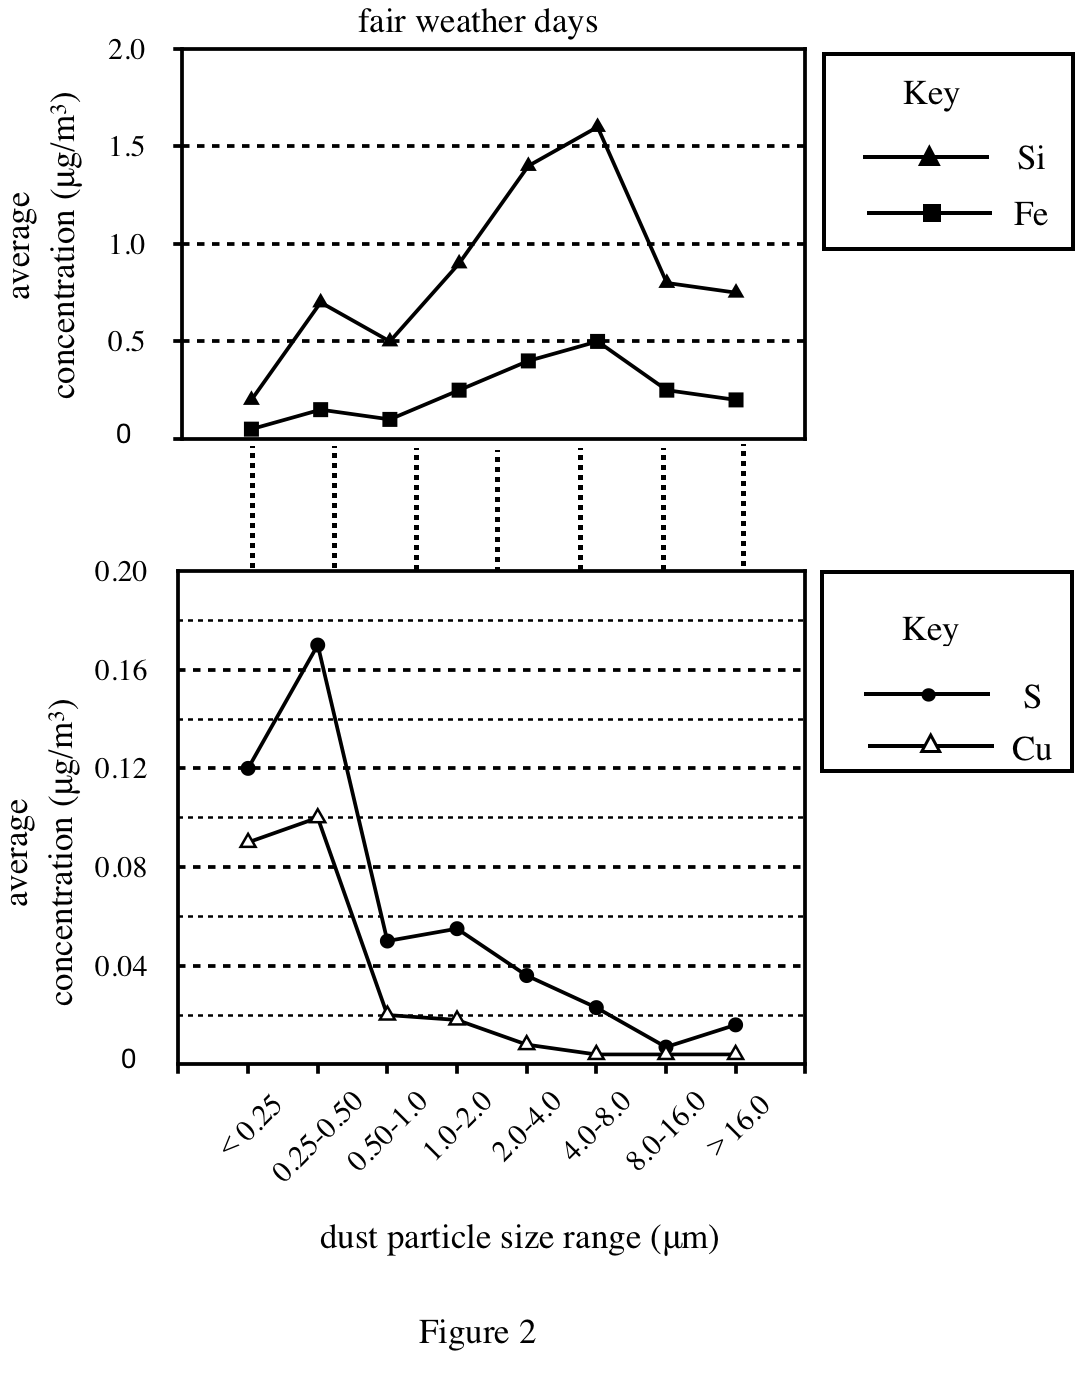
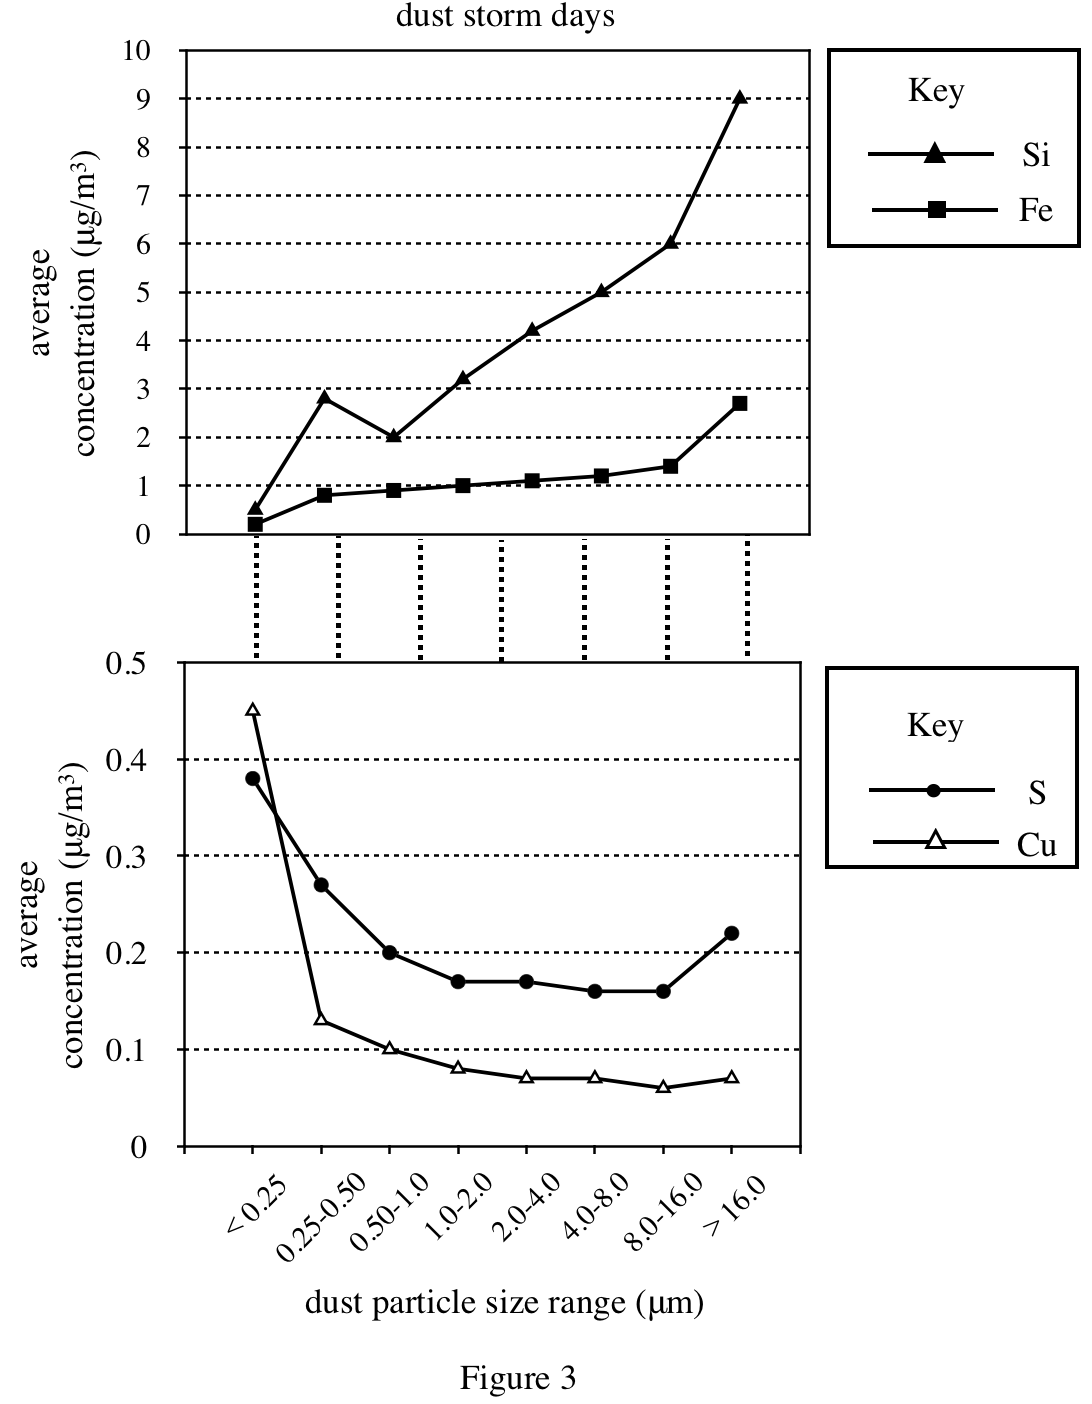
38. For both the fair weather days and the dust storm days, why were the results for Si and Fe plotted on a different y-axis scale than were the results for S and Cu ?
Answer and Explanation
Your Answer is
Correct Answer is G
Explanation
From figures 2 & 3, it can be seen that no matter what the weather is, the content of Si and Fe in the air is tens or hundreds of times higher than that of S and Cu, so it is not convenient to put them in the same coordinate system. Use The same vertical coordinate representation. So option G is reasonable