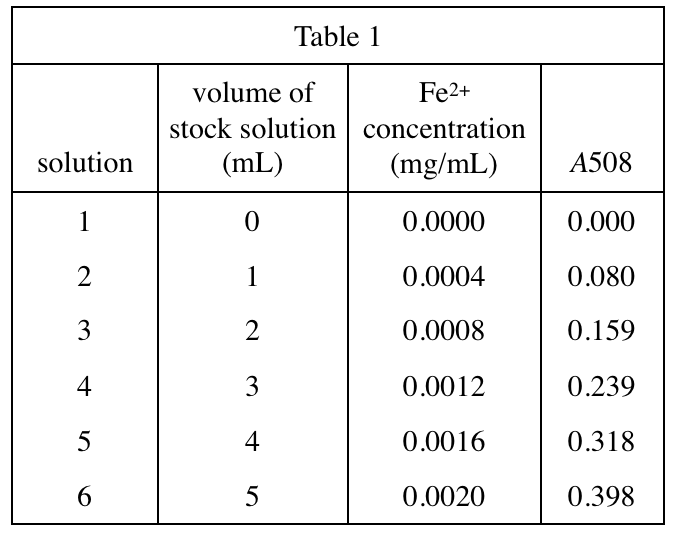
29. Which of the following graphs best shows the relationship between Fe2+ concentration and A508 in Experiment 1?
Answer and Explanation
Your Answer is
Correct Answer is A
Explanation
It can be seen from table 1 that when the volume of stock solution increases by 1 mL, the value of A508 also increases by about 0.080, so the image should be a straight line with a positive slope, and option A is reasonable