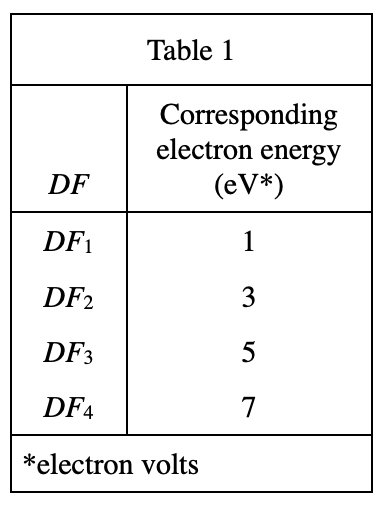
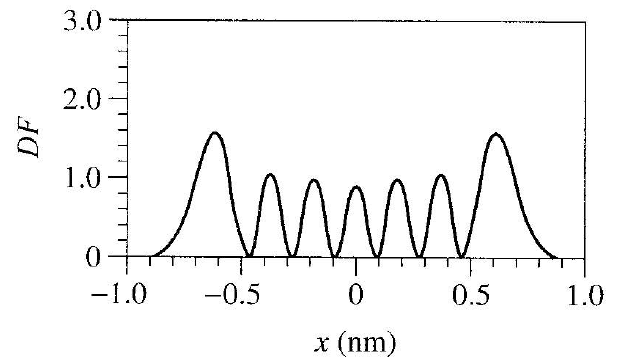
36. The figure below most likely shows which DF?
Answer and Explanation
Your Answer is
Correct Answer is H
Explanation
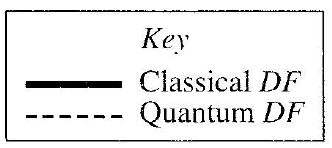
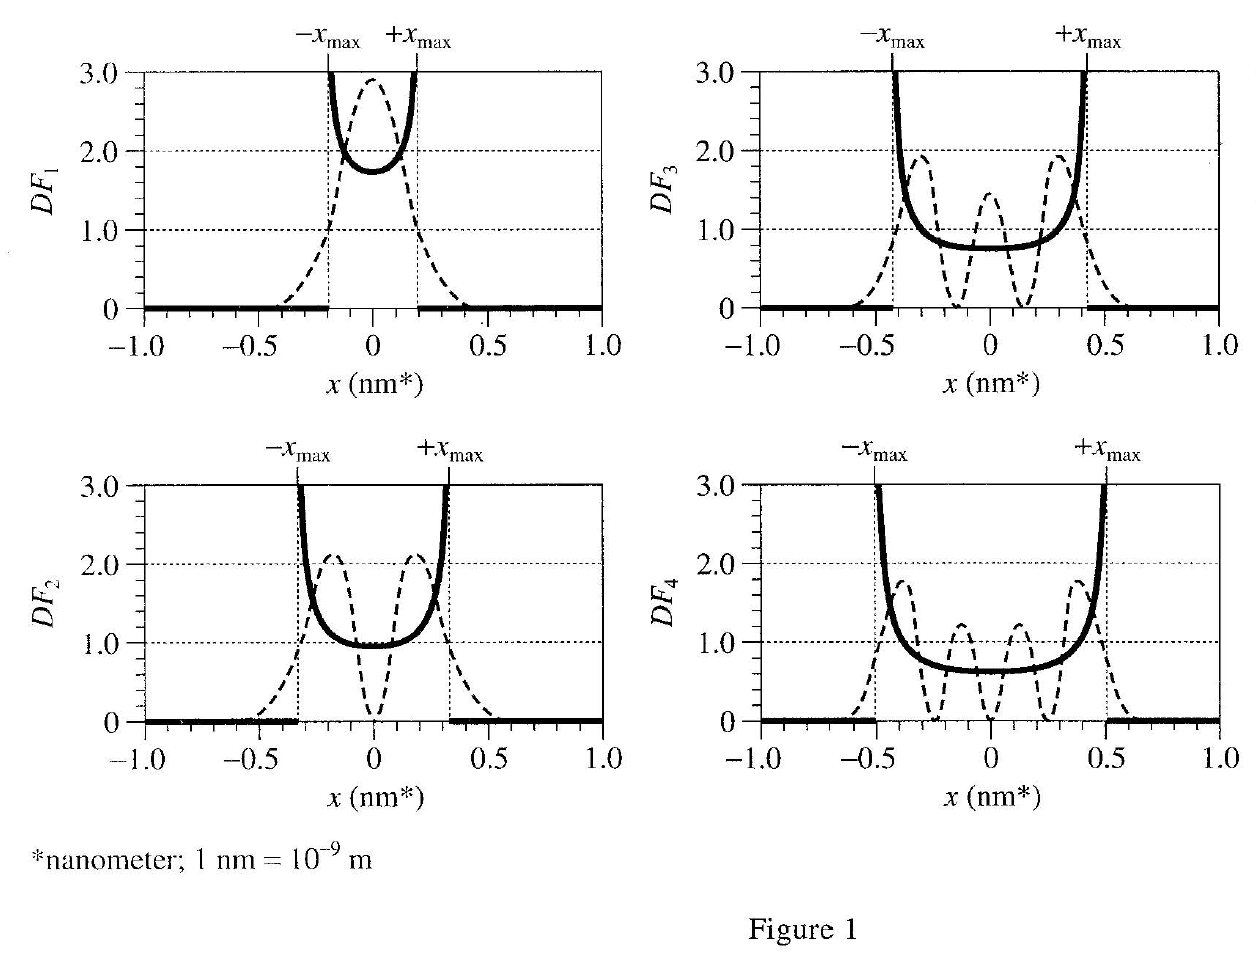
From figure 1, it can be seen that the waveform given by the chart in the title is closer to the waveform of Quantum DF represented by the dotted line in figure 1, so H or J must be selected;
According to figure 1, DF The subscript numbers represent how many peaks the dotted line wave will have. There are 7 peaks in the chart given in the title, so it is Quantum DF7