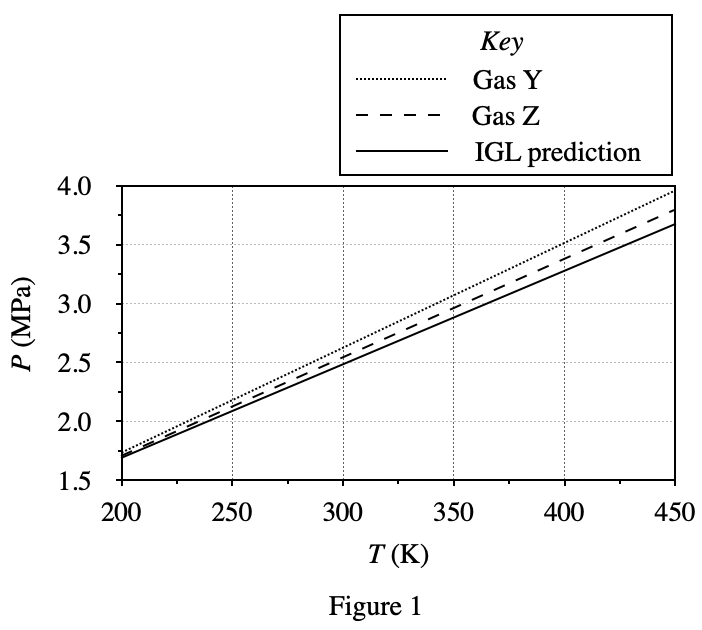
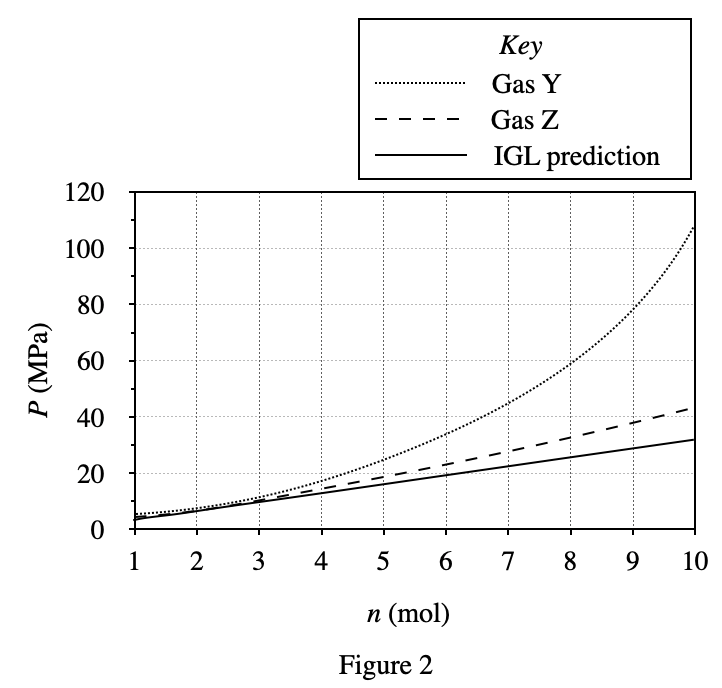
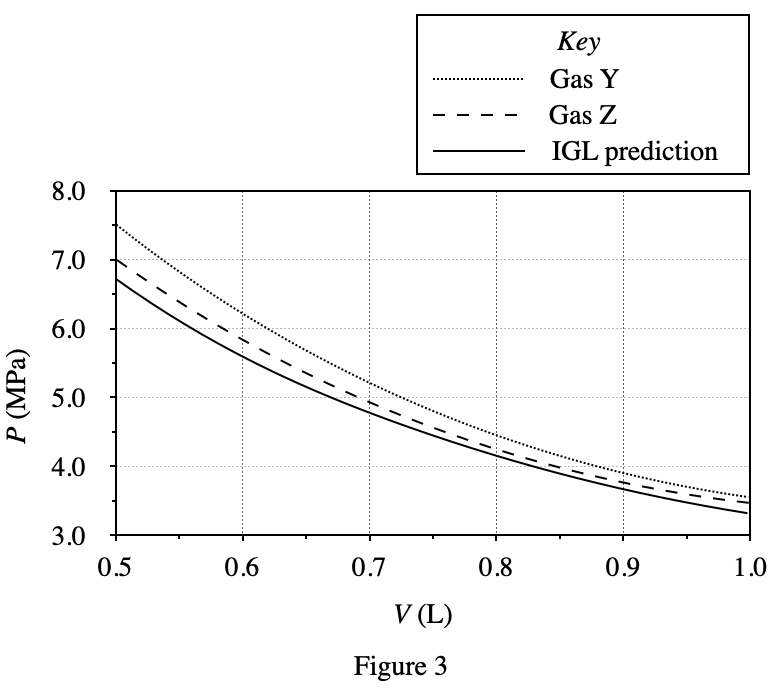
34. In which experiments was T held constant?
Your Answer is
Correct Answer is H
Explanation
Comparing the three charts, it can be seen that only in figure 1 corresponding to Experiment 1, the independent variable represented by the abscissa is T;
T is neither an independent variable nor a cause in the last two charts variable, so T in Experiments 2 & 3 is a constant


