30. Based on the results of Study 1, which of the following graphs best represents the relationship between KE and v?
Answer and Explanation
Your Answer is
Correct Answer is G
Explanation
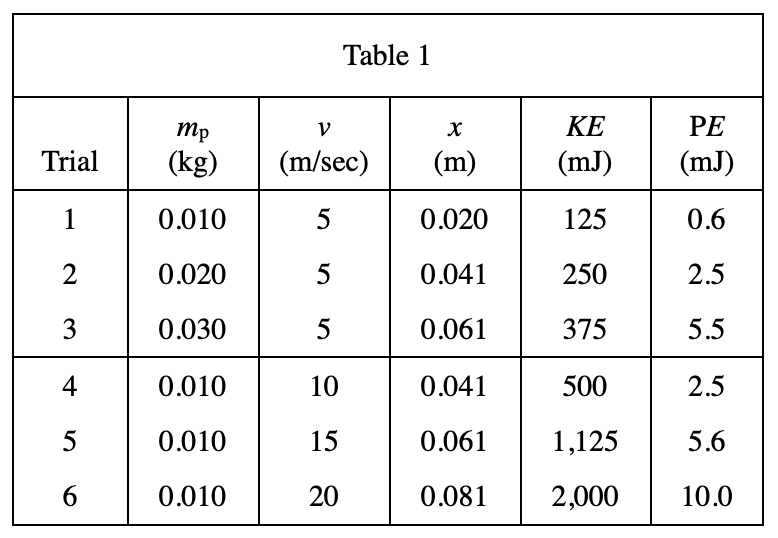
Looking at trials 4-6 in table 1, it can be seen that when other independent variables are the same, KE will increase as v increases, so H and J options are excluded;
Look at the data in table 1 and find , with the increase of v, the growth rate of KE becomes faster, indicating that the slope of the line segment will increase, so only G can be selected