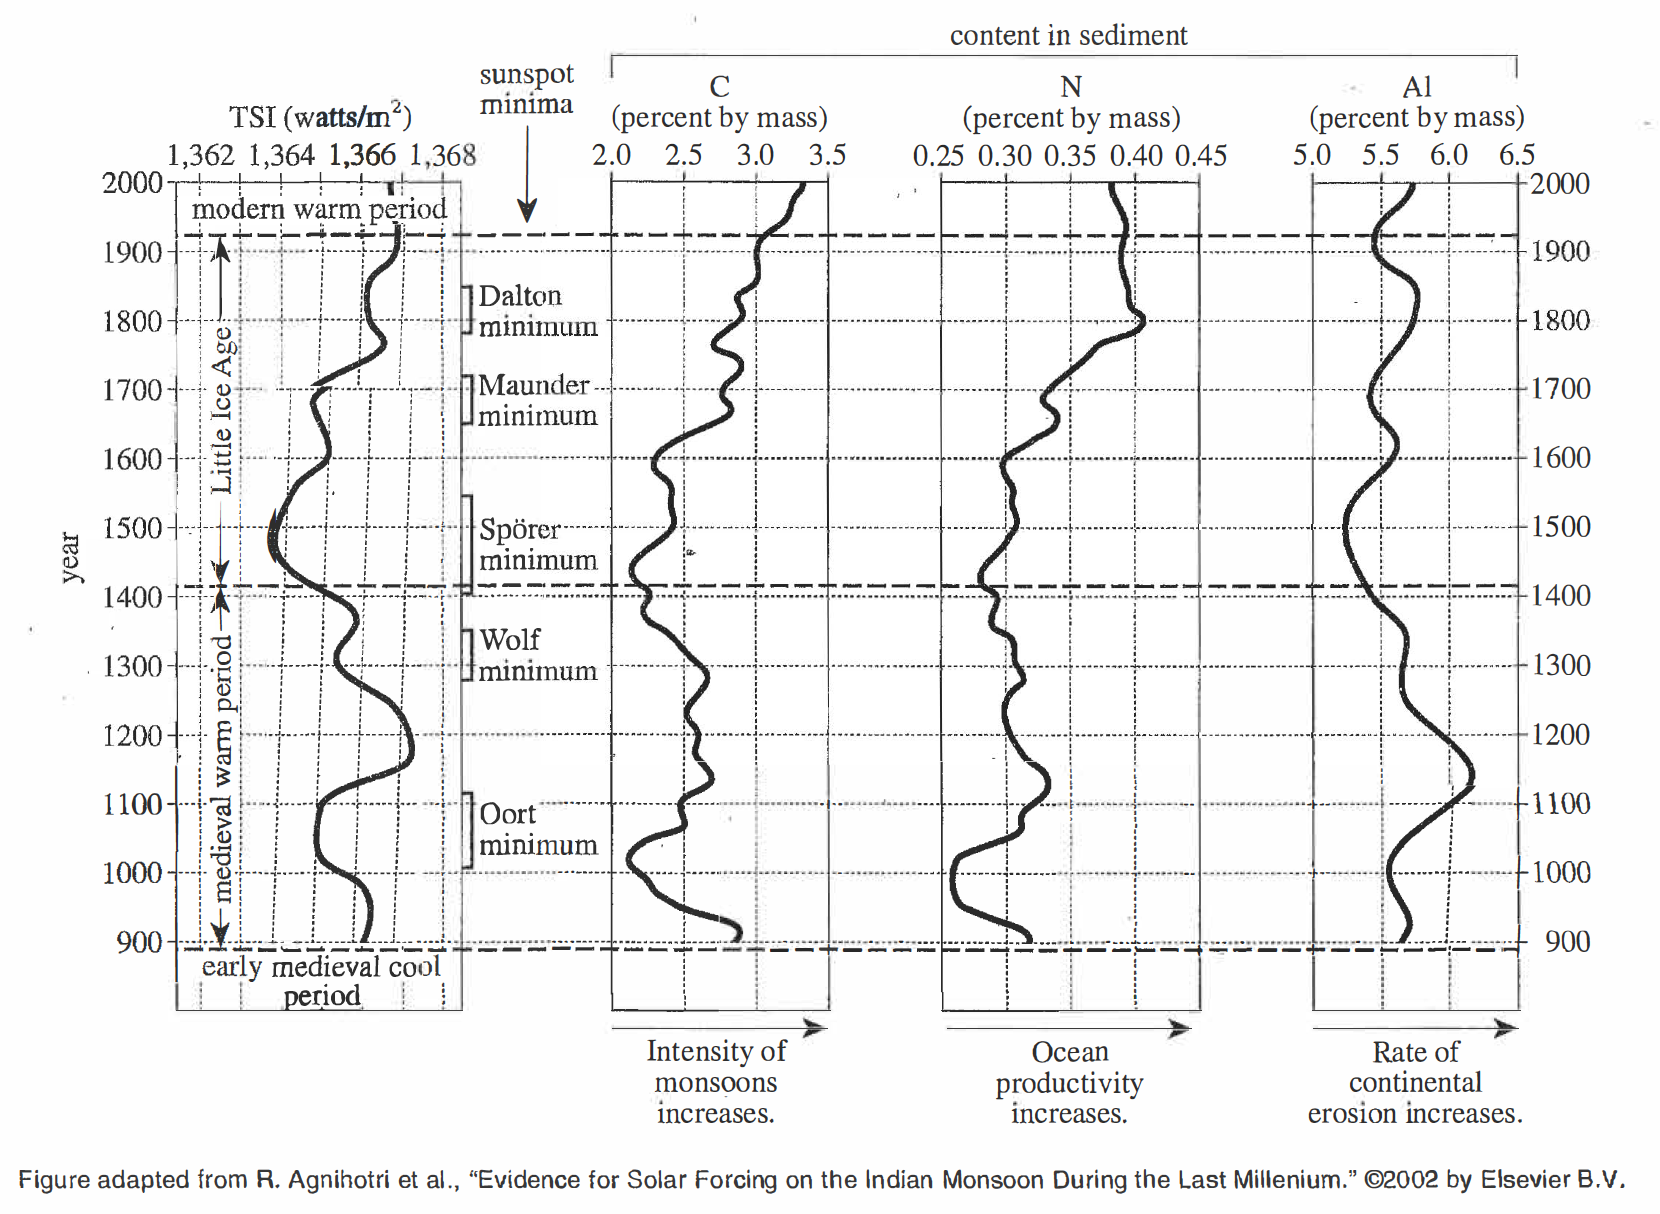
2. The figure indicates that the greatest increase in percent by mass of N at the Indian Ocean location occurred over which of the following 100-year periods?
Your Answer is
Correct Answer is J
Explanation
Looking at the change curve of N content in the third small picture, it can be seen that the fastest growth occurred in 1700-1800
