
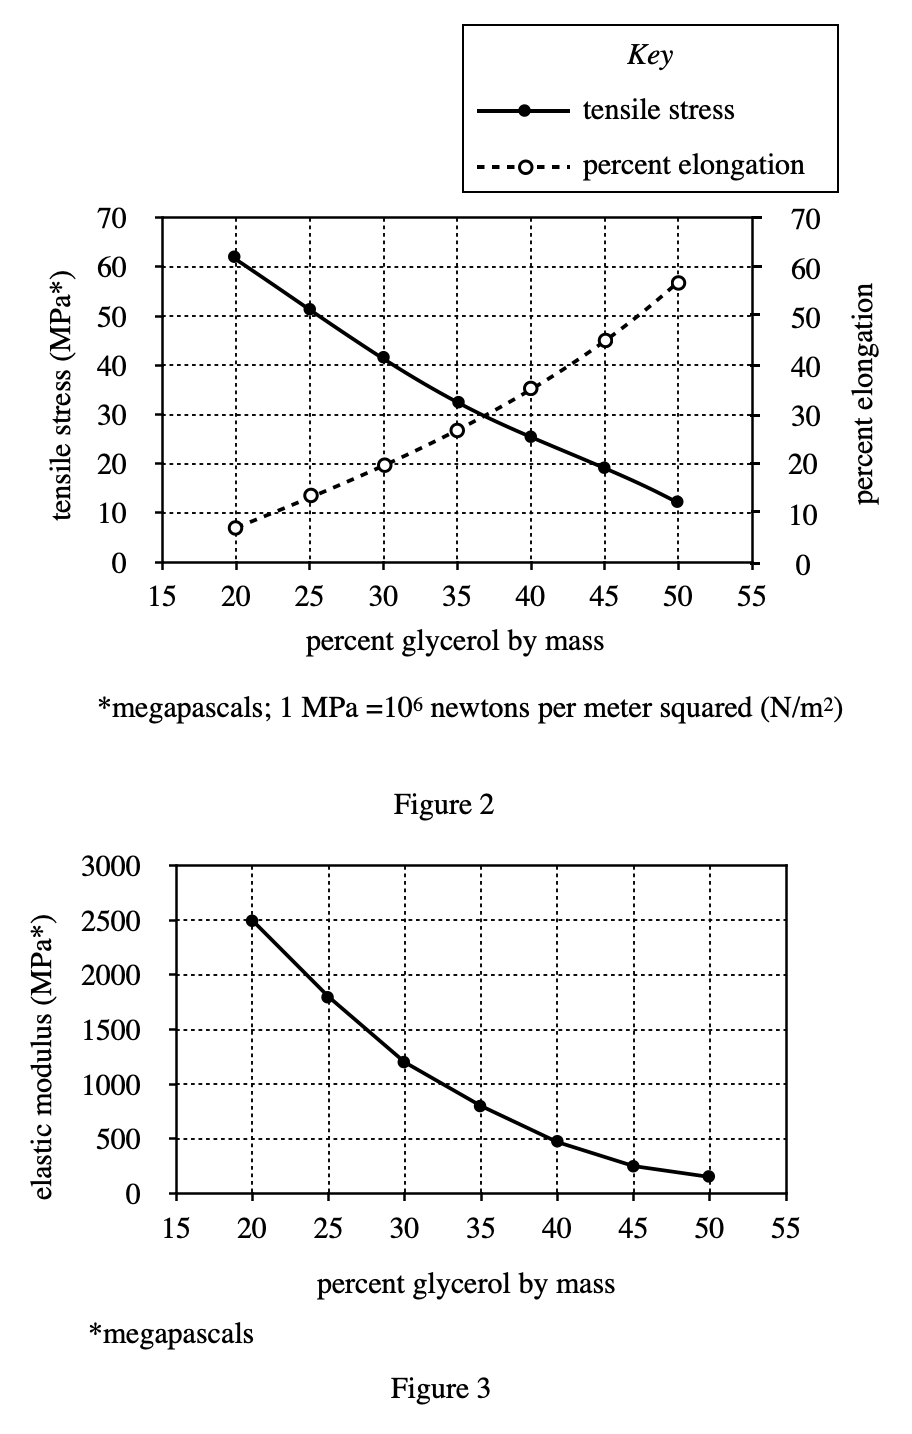
11. Based on Figure 2, which of the following graphs best shows the percent elongation results for the films made from mixtures that were, respectively, 30%, 40%, and 50% glycerol by mass?
Answer and Explanation
Your Answer is
Correct Answer is C
Explanation
Look at the solid line in figure 2, when the abscissa of the curve is 30, 40, 50, the ordinate is about 41, 25, 13