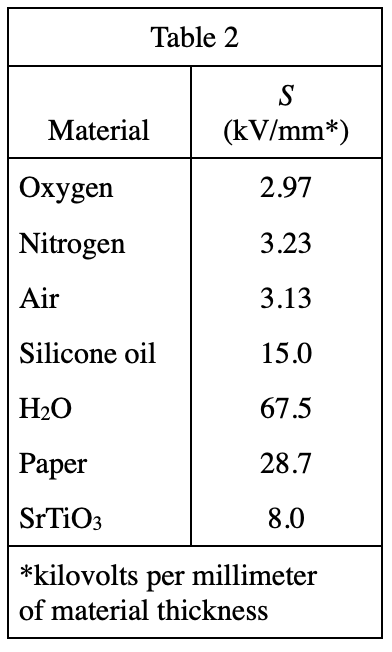
30. Based on Table 2, which of the following graphs best. represents S for H2O, silicone oil, paper, and SrTiO3?
Answer and Explanation
Your Answer is
Correct Answer is J
Explanation
Looking at table 2, the value of SrTiO3 is the smallest, so F and G options are excluded;
Looking at the value of paper in table 2 is greater than the value of silicone oil, So choose J directly