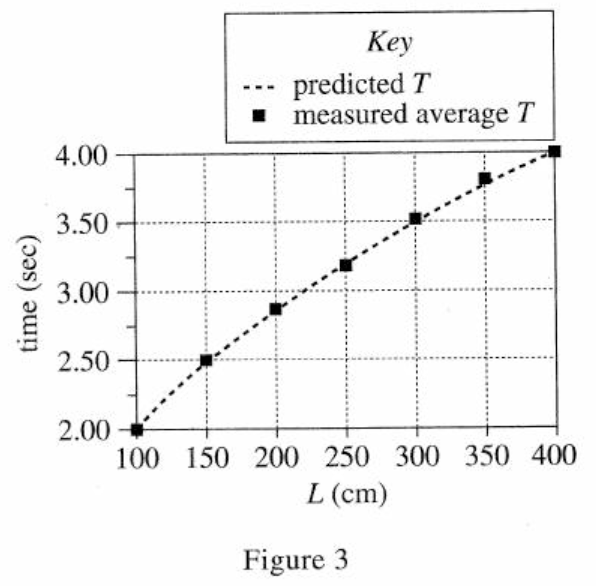
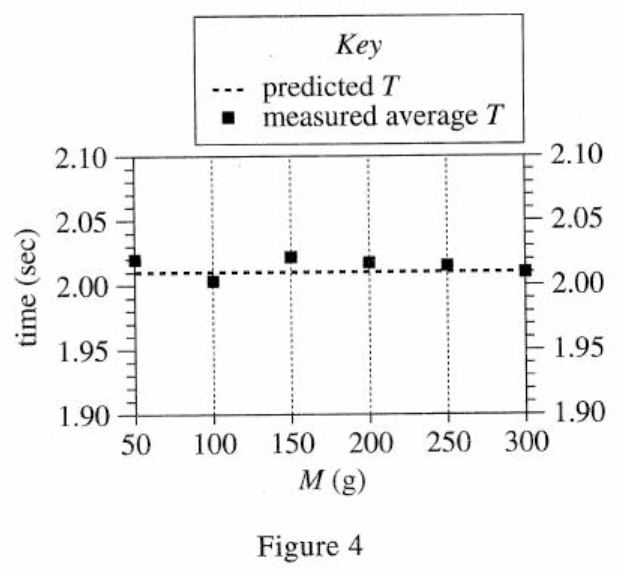
22. Suppose Experiment 3 had been repeated, except that each pendulum had a string length of 200 cm. Based on the results of Experiments 2 and 3, the graph of predicted T versus M for the pendulums would most likely have been a:
Answer and Explanation
Your Answer is
Correct Answer is G
Explanation
It can be seen from figure 3 that T will increase with the increase of L; from figure 4, T will not change with the change of M. Therefore, when L changes from 100 to 200 and L increases, T will be larger than the original value, and will not change with the change of M