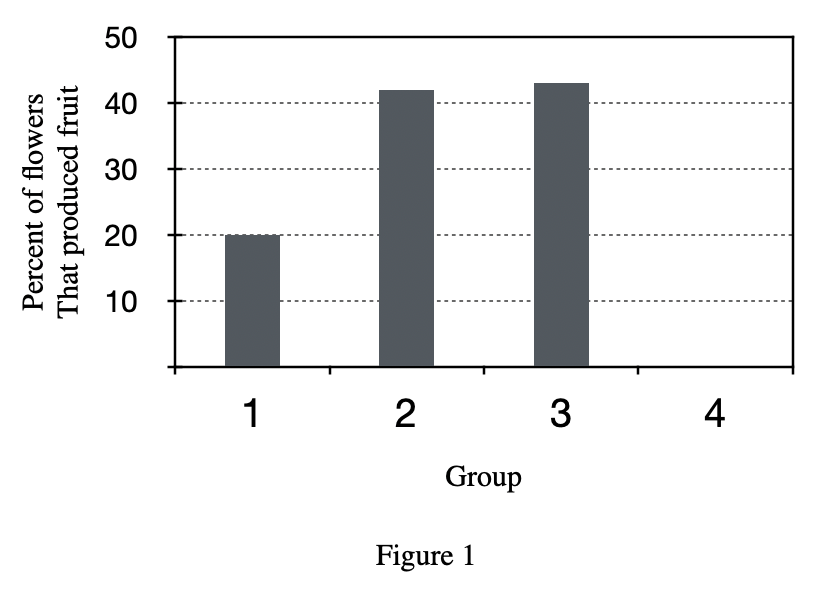
10. For any group, the value shown in Figure 1 was most likely calculated using which of the following expressions?
Answer and Explanation
Your Answer is
Correct Answer is H
Explanation
General knowledge questions.
figure 1 measures the percentage of flowers that produced fruit, because it is a percentage, so it must be a small group divided by the whole;
The small group represented by the molecule is the fruit of the fruit The number, and the population represented by the denominator should be the total number of flowers