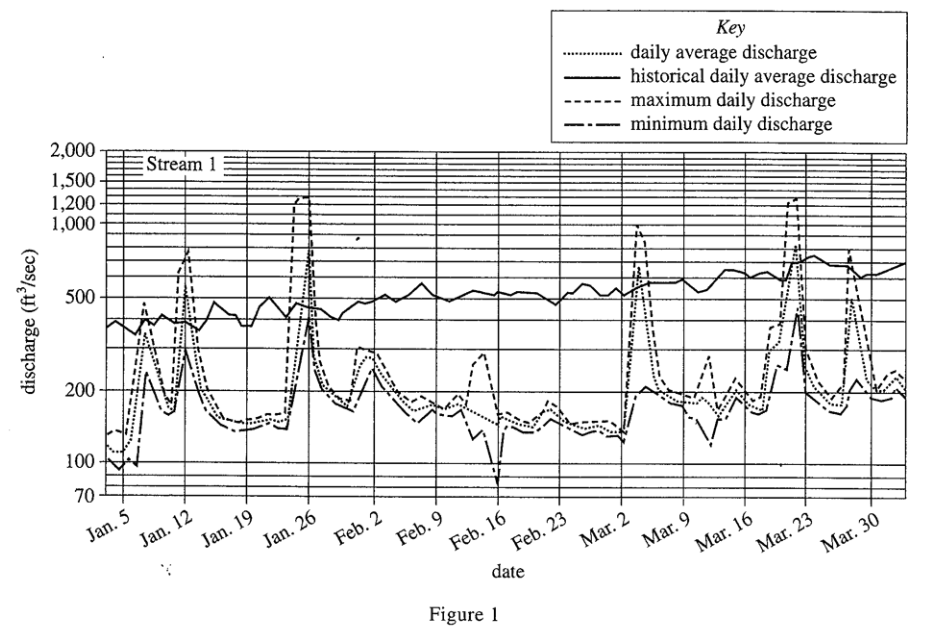
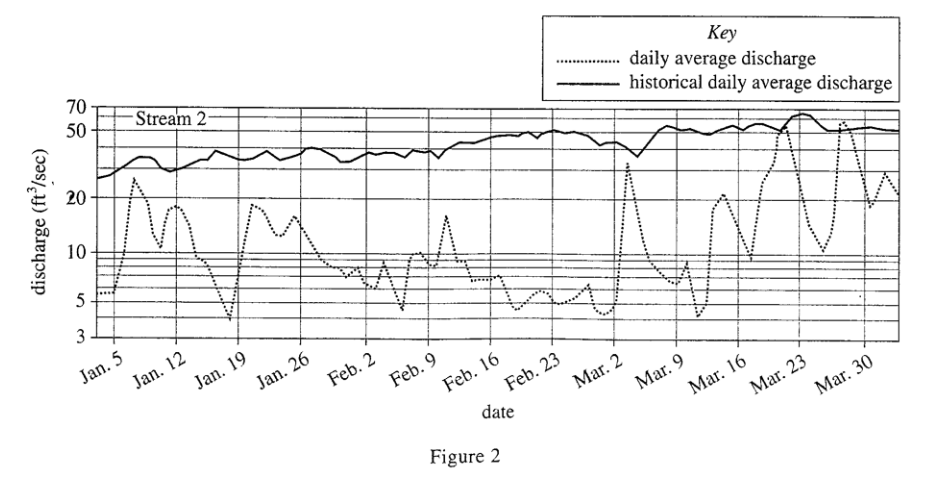
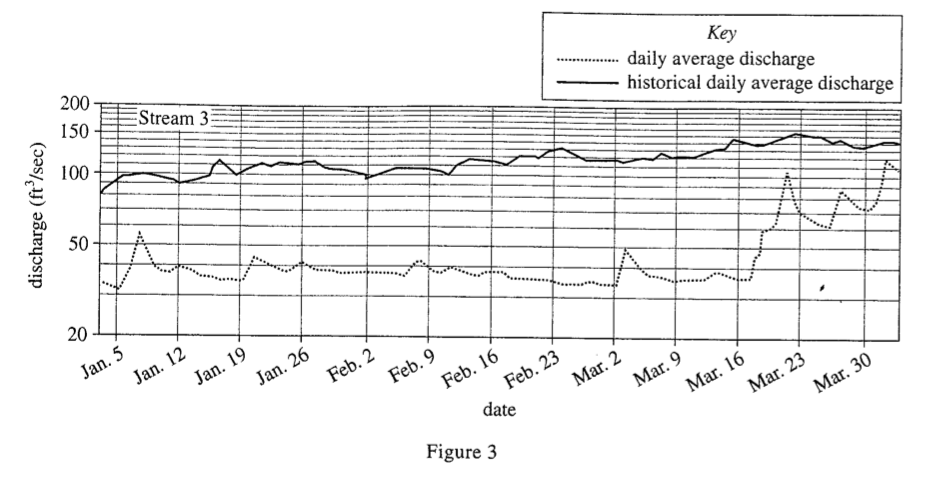
7. According to Figures 1-3, as time elapsed from January 5 to March 30, the historical daily average discharge generally increased for:
Answer and Explanation
Your Answer is
Correct Answer is D
Explanation
Look at the solid line historical daily average discharge in figures 1-3, there is an increasing trend