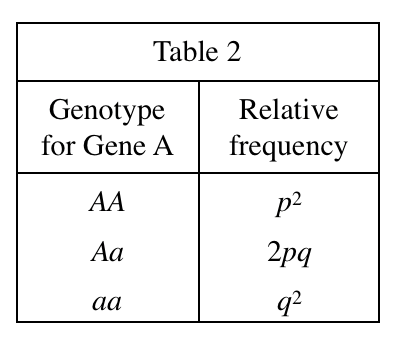
32. Based on Table 2, which of the following figures best represents the relationship between p and the relative frequency of AA in a population in HWE ?
Answer and Explanation
Your Answer is
Correct Answer is F
Explanation
According to table 2, the probability of AA is p2, so it should have an exponential relationship with p, and you should choose F