 Study 3
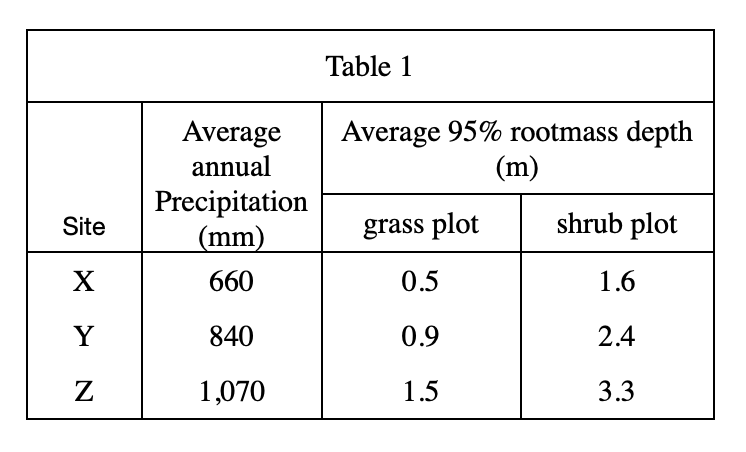
38. According to the results of Study 2, in which of the following plots did the C content change the most from a depth of 0 m to a depth of 2.0 m ?
Answer and Explanation
Your Answer is
Correct Answer is F
Explanation
From figure 2, it can be seen that the maximum and minimum values of the abscissa in site X differ the most, that is, the change is the largest;
Because the minimum values of grass and shrub are basically the same, and the maximum value of grass It is greater than the maximum value of shrub, so the C content of grass in site X has the largest change amount