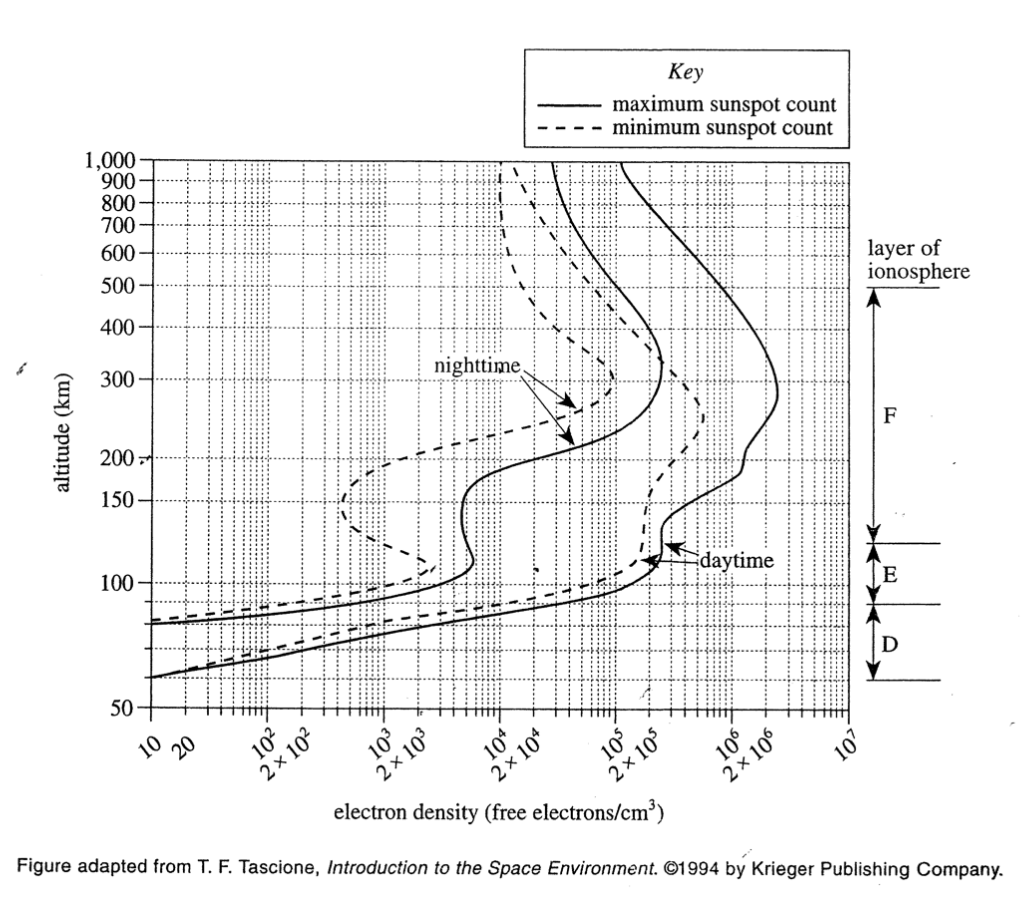
37. Which of the following graphs best represents the nighttime and the daytime electron densities shown in the figure for an altitude of 200 km at minimum sunspot count?
Answer and Explanation
Your Answer is
Correct Answer is B
Explanation
The condition in the question stem is minimum sunspot count, so you should look at the two dotted lines in the picture, and then look at the altitude given in the question is 200 km, so when the ordinate is 200, the abscissa corresponding to the daytime curve is about It is 105, and the abscissa of nighttime is about 103, so you should choose B