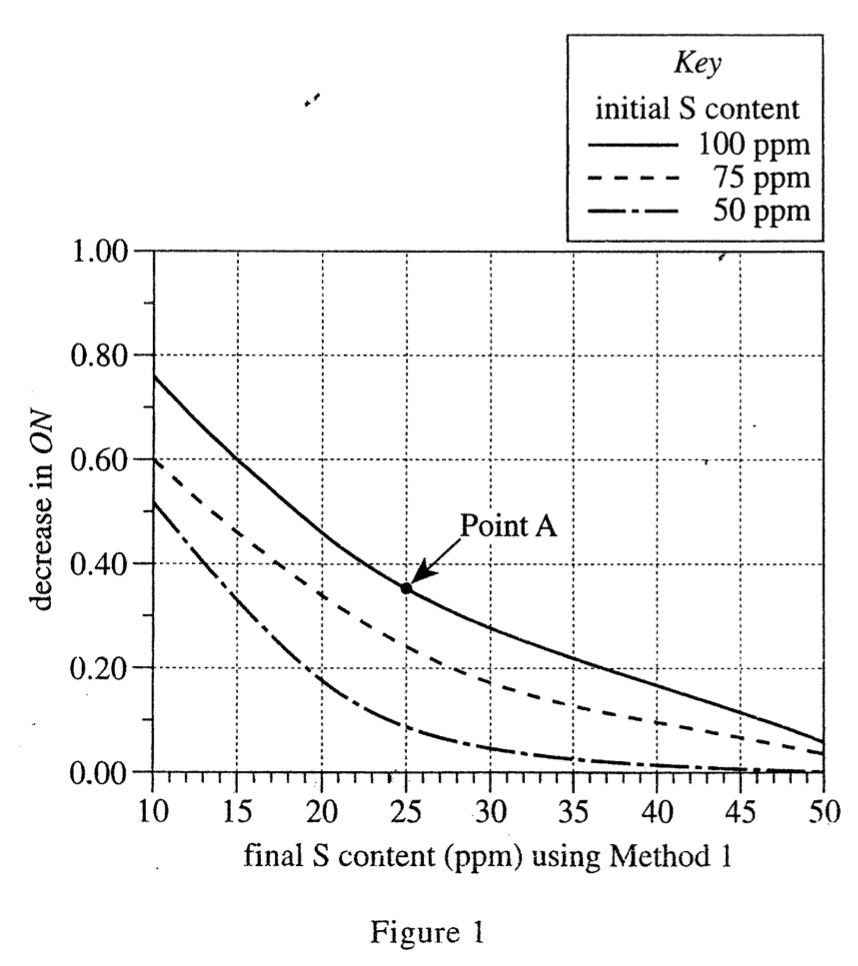
24. Consider 3 gasolines having S contents of 50 ppm, 75 ppm, and 100 ppm, respectively. According to Figure 1, if Method 1 is used to decrease each fuel's S content to 15 ppm, the decrease in ON for each fuel is best shown by which of the following graphs?
Answer and Explanation
Your Answer is
Correct Answer is G
Explanation
Look at figure 1, when the abscissa final S content is 15ppm, the vertical coordinates corresponding to the three curves of 50 ppm, 75 ppm, and 100 ppm are decomposed into 0.35, 0.45, and 0.6, so it is the G option