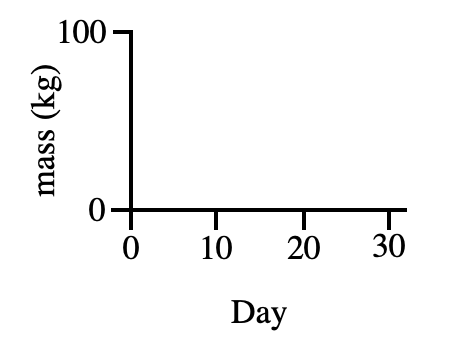
19. If the raw data for the average mass of the 5 plant lines in Experiment 2 were plotted on the graph below and a best-fitting line was drawn for each of the 5 plant lines, how many of the best-fitting lines would have a positive slope and how many would have a negative slope?
Answer and Explanation
Your Answer is
Correct Answer is C
Explanation
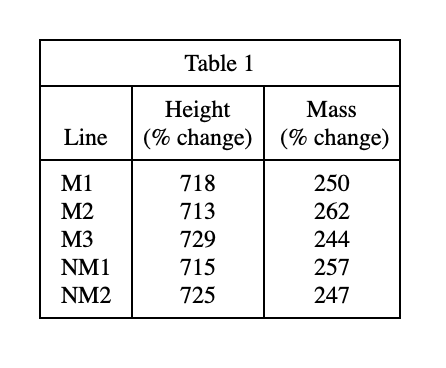
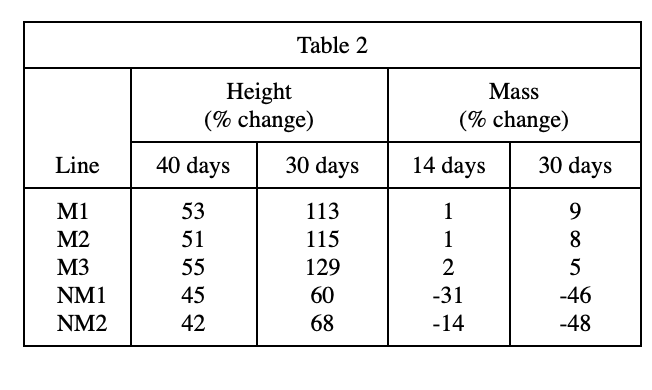
Looking at table 2, it can be found that in the Mass (%change) column, the quality of M1, M2, and M3 has increased, so the slopes of the three curves are positive;
The quality of NM1 and NM2 decreased, so the slope of the two curves is negative