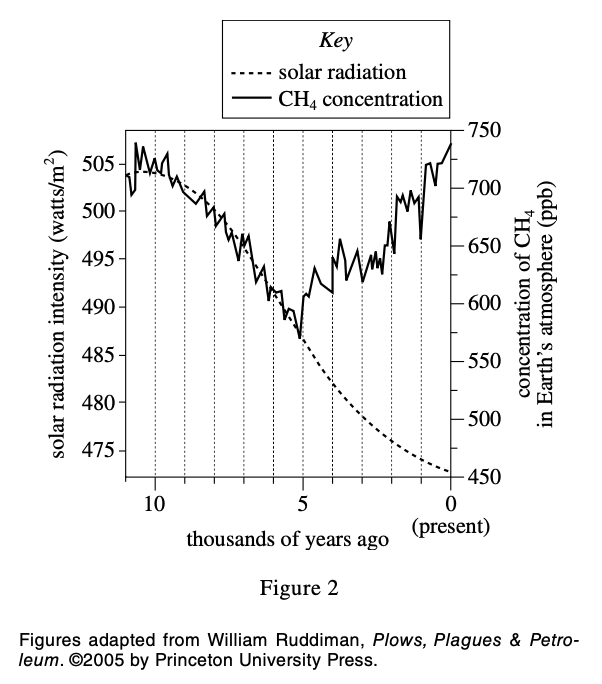
16. Suppose that whenever the CH4 concentration increases, a corresponding, immediate increase in average global temperature occurs, and that whenever the CH4 concentration decreases, a corresponding, immediate decrease in average global temperature occurs. Based on Figure 2, which of the following graphs best represents a plot of average global temperature over the past 11,000 years?
Answer and Explanation
Your Answer is
Correct Answer is G
Explanation
According to the title, it can be seen that CH4 concentration and temperature are positively correlated.
Looking at figure 2, I found that the CH4 curve in the figure first decreases and then rises, so the temperature in this question should also fall first and then rise